Tackle the Test: Free-Response Questions
Question
Refer to the table below. Assume the firm can sell all of the output it produces at a price of $15.
Quantity of labor (workers)Quantity of output 0
1
2
3
4
5
6
0
300
550
700
800
850
890
What is the marginal revenue product of labor of the 3rd worker?
Draw a correctly labeled graph showing the firm’s demand curve for labor.
What happens to the demand curve for labor if the price of the product increases to $20? Show the result on your graph from part b.
Assume that a technological advance doubles the productivity of workers. Calculate the total quantity that will now be produced with each quantity of workers.
Page 698Rubric for FRQ 1 (7 points)
1 point: MRPL = 150 × $15 = $2,250
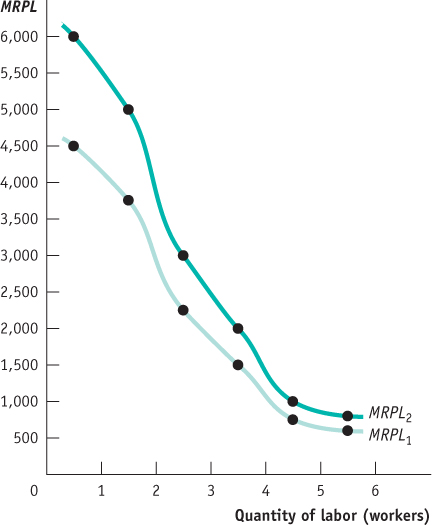
1 point: The vertical axis is labeled “MRPL” and/or “Wage rate”; the horizontal axis is labeled “Quantity of labor.”
1 point: MRPL is downward-
sloping and labeled. 1 point: MRPL is plotted using correct numbers (see graph).
1 point: The demand curve for labor shifts to the right.
1 point: MRPL curve is shown shifted to the right.
1 point: The new quantities produced are 600; 1,100; 1,400; 1,600; 1,700; and 1,780.
Question
Draw a separate, correctly labeled graph illustrating the effect of each of the following changes on the demand for labor. Adopt the usual ceteris paribus assumption that all else remains unchanged in each case.
The price of the product being produced decreases.
Worker productivity increases.
Firms invest in more capital to be used by workers.(5 points)
Rubric for FRQ 2 (5 points)
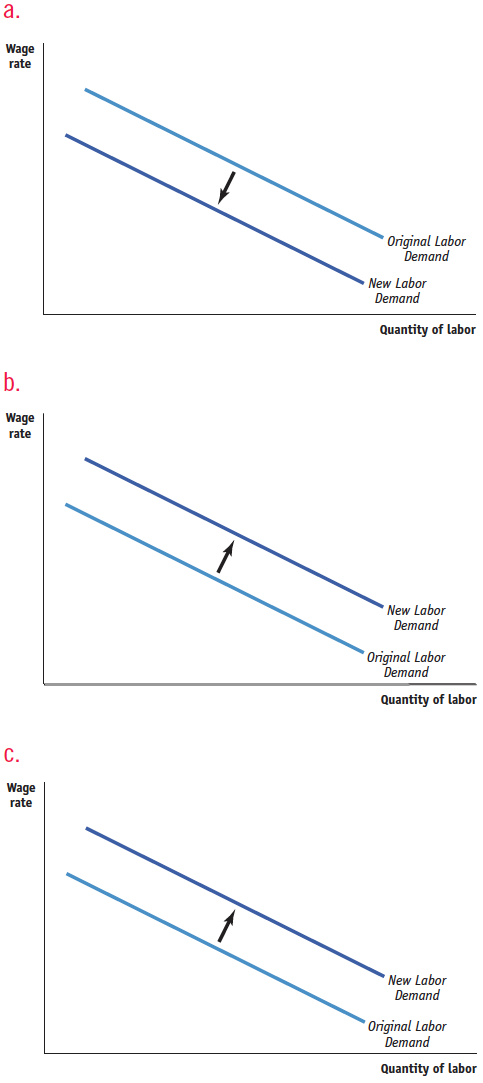
1 point: The vertical axis on each graph is labeled “MRPL” and/or “Wage rate”; the horizontal axis on each graph is labeled “Quantity of labor.”
1 point: The labor demand curve on each graph is downward-sloping and labeled.
1 point: The graph for part a illustrates a shift downward/leftward.
1 point: The graph for part b illustrates a shift upward/rightward.
1 point: The graph for part c illustrates a shift upward/rightward.