Tackle the Test: Free-Response Questions
Question
Tesla Motors makes sports cars powered by lithium batteries.
Draw a correctly labeled graph showing a hypothetical supply curve for Tesla sports cars.
On the same graph, show the effect of a major new discovery of lithium that lowers the price of lithium.
Suppose Tesla Motors expects to be able to sell its cars for a higher price next month. Explain the effect that will have on the supply of Tesla cars this month.
Tesla Motors makes sports cars powered by lithium batteries.Rubric for FRQ 1 (4 points)
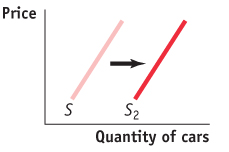
1 point: Graph with “Price” or “P” on the vertical axis and “Quantity” or “Q” on the horizontal axis
1 point: Positively-
sloped curve labeled “Supply” or “S” 1 point: A second supply curve shown to the right of the original supply curve with a label such as S2 indicating that it is the new supply curve
1 point: Correct explanation that the expectation of higher prices next month would lead to a decrease in the supply of Tesla cars this month because the company will want to sell more of its cars when the price is higher
Question
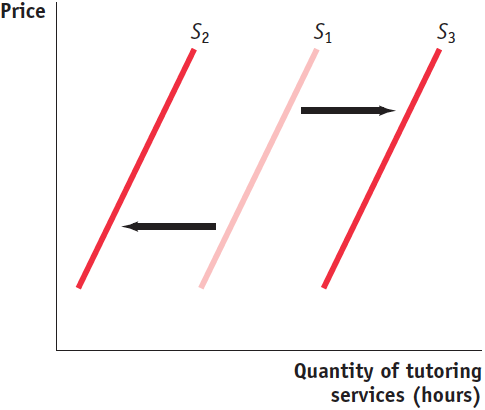
Suppose AP® Economics students at your school offer tutoring services to students in regular economics courses.
Draw a correctly labeled graph showing the supply curve for tutoring services measured in hours. Label the supply curve “S1”.
Suppose the wage paid for babysitting, an alternative activity for AP® Economics students, increases. Show the effect of this wage increase on the graph you drew for part a. Label the new supply curve “S2”.
Suppose instead that the number of AP® Economics students increases. Show the effect of this increase in AP® Economics students on the same graph you drew for parts a and b. Label the new supply curve “S3”. (3 points)
Suppose AP® Economics students at your school offer tutoring services to students in regular economics courses.Rubric for FRQ 2 (3 points)
Rubric for FRQ 2 (3 points)
1 point: A graph with the vertical axis labeled “Price” or P, the horizontal axis labeled “ Quantity” or Q, and an upward-sloping supply curve labeled S1.
1 point: A supply curve labeled S2 is shown to the left of S1.
1 point: A supply curve labeled S3 is shown to the right of S1.