Tackle the Test: Free-Response Questions
Question
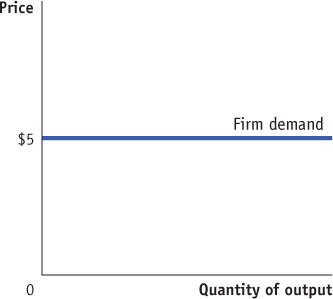
Assume the demand curve for a firm’s product is as shown below and that the firm can hire as many workers as it wants for a wage of $80 per day.
What is the market structure of the factor market in which the firm hires labor? Explain.
What is the market structure of the product market in which the firm sells its good? Explain.
Define marginal factor cost. What is the marginal factor cost of labor for this firm?
If the last worker hired produces an additional 20 units of output, what is the last worker’s MRPL? Explain.
Rubric for FRQ 1 (8 points)
1 point: The firm hires labor in a perfectly competitive labor market.
1 point: The firm is a price-
taker in the labor market. (It can hire all that it wants for $80 per day.) 1 point: The firm sells its good in a perfectly competitive product market.
1 point: The horizontal demand curve indicates that the firm is a price-
taker in the product market (it can sell all the output it wants at the market price of $5). 1 point: the additional cost of hiring one more unit of a factor
1 point: $80
1 point: $100
1 point: MRPL = MPL × MR, MPL = 20, MR = $5, so MRPL = 20 × $5 = $100.
Question
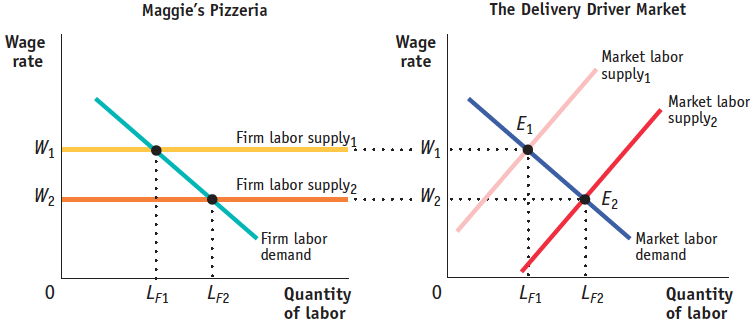
Maggie’s Pizzeria hires delivery drivers from a perfectly competitive labor market.
Draw correctly labeled side-
by- side graphs of delivery driver supply and demand for Maggie’s Pizzeria and for the entire delivery driver market. On your graphs, show how an increase in the supply of delivery drivers would affect the equilibrium wage and the number of drivers hired, both by Maggie’s Pizzeria and in the delivery driver market as a whole. (8 points)
Rubric for FRQ 2 (8 points)
1 point: The vertical axes are labeled “Wage rate” and the horizontal axes are labeled “Quantity of labor.”
1 point: The initial firm labor supply curve is labeled, horizontal, and at the level of the initial equilibrium wage.
1 point: The firm labor demand curve is labeled and downward-sloping.
1 point: The market labor supply curve is upward-sloping and the market labor demand curve is downward-sloping.
1 point: The initial equilibrium wage rate and quantities of labor are labeled in the correct locations along the axes for both the firm and market.
1 point: The market’s new labor supply curve is to the right of its initial labor supply curve.
1 point: The firm’s new labor supply curve is horizontal at the level of the new equilibrium wage.
1 point: The new equilibrium wage rate and quantities of labor are labeled in the correct locations along the axes for both the firm and market.