Tackle the Test: Free-Response Questions
Question
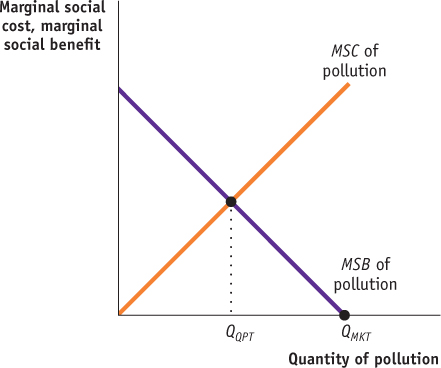
Draw a correctly labeled graph showing the market-
determined quantity of pollution, and explain why that quantity will be chosen in the absence of intervention and private deals. On the same graph, show the socially optimal level of pollution. Rubric for FRQ 1 (6 points)

1 point: The vertical axis is labeled “Marginal social cost, marginal social benefit” or “Dollars per unit” and the horizontal axis is labeled “Quantity of pollution” or “Q.”
1 point: The marginal social cost curve is labeled and upward-
sloping. 1 point: The marginal social benefit curve is labeled and downward-
sloping. 1 point: The market-
determined level of pollution is shown on the horizontal axis where the marginal social benefit curve reaches the horizontal axis. 1 point: In the absence of intervention and private deals, the marginal cost to a polluter of polluting is zero. Thus, pollution will continue until the marginal social benefit (all of which goes to the polluter) equals the polluter’s marginal cost of zero, which occurs at the horizontal intercept of the marginal social cost curve.
1 point: The socially optimal level of pollution is shown on the horizontal axis below the intersection of MSC and MSB.
Question
Define the marginal social cost of pollution.
Define the marginal social benefit of pollution, and explain why polluting more can provide benefits to a firm even when it could produce the same quantity of output without polluting as much.
Define the socially optimal level of pollution.(4 points)
Rubric for FRQ 2 (4 points)
1 point: The marginal social cost of pollution is the additional cost imposed on society by an additional unit of pollution.
1 point: The marginal social benefit of pollution is the additional benefit to society from an additional unit of pollution.
1 point: Even when a firm could provide the same quantity of output without polluting as much, there is a benefit from polluting more because the firm can devote less money and resources to pollution avoidance.
1 point: The socially optimal level of pollution is that level at which the marginal social benefit of pollution equals the marginal social cost.