Production, Consumption, and Externalities
Nobody imposes external costs like pollution out of malice. Pollution, traffic congestion, and other negative externalities are side effects of activities, like electricity generation, manufacturing, or driving, that are otherwise desirable. We’ve just learned how government regulators can move the market to the socially optimal quantity when the side effects can be directly controlled. But as we cautioned earlier, in some cases it’s not possible to directly control the side effects—
This approach, although slightly more complicated, has several advantages. First, for activities that generate external costs, it gives us a clear understanding of how the desirable activity is affected by policies designed to manage its side effects. Second, it helps us think about a question that is different but related to the problem of external costs: what should be done when an activity generates external benefits. It’s important to realize that not all externalities are negative. In fact, we encounter many positive externalities every day; for example, a neighbor’s bird-
Using the approach of targeting the activity behind the externalities, we’ll now turn our attention to the topic of positive externalities.
Private Versus Social Benefits
Earlier, we pointed out that getting a flu shot has benefits to people beyond the person getting the shot. Under some conditions, getting a flu vaccination reduces the expected number of other people who get the flu by as much as 1.5. This prompted one economist to suggest a new T-

The government can directly control the external costs of pollution because it can measure emissions. In contrast, it can’t observe the reduction in flu cases caused by you getting a flu shot, so it can’t directly control the external benefits—
From the point of view of society as a whole, a flu shot carries both costs (the price you pay for the shot, which compensates the vaccine maker and your health care provider for the inputs and factors of production necessary to grow the vaccine and deliver it to your bloodstream) and benefits. Those benefits include the private benefit that accrues to you from not getting the flu yourself, but they also include the external benefits that accrue to others from a lower likelihood of catching the flu. However, you have no incentive to take into account the beneficial side effects that are generated by your actions. As a result, in the absence of government intervention, too few people will choose to be vaccinated.
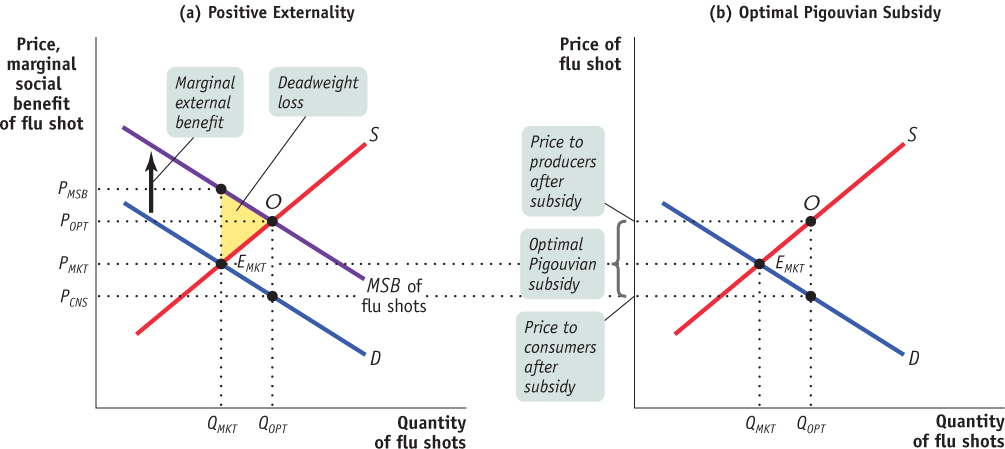
Panel (a) of Figure 75.3 illustrates this point. The market demand curve for flu shots is represented by the curve D; the market, or industry, supply curve is given by the curve S. In the absence of government intervention, market equilibrium will be at point EMKT, with QMKT flu shots being bought and sold at the market price of PMKT. At that point, the marginal cost to society of another flu shot is equal to the marginal benefit gained by the individual consumer who purchases that flu shot, measured by the market price.
| Figure 75.3 | Positive Externalities and Consumption |
The marginal private benefit of a good is the marginal benefit that accrues to consumers of a good, not including any external benefits.
The marginal social benefit of a good is the marginal private benefit plus the marginal external benefit.
The marginal external benefit of a good is the addition to external benefits created by one more unit of the good.
So far we have studied goods in the absence of external benefits, so the marginal benefit to the consumer has been no different from the marginal benefit to society. When a good like flu shots creates positive externalities, there is a difference between the marginal benefit to the consumer, which we’ll distinguish by calling it the marginal private benefit, and the marginal benefit to society, called the marginal social benefit of a good (or similarly, of a service or activity). The difference between the marginal private benefit (MPB) and the marginal social benefit (MSB) is the marginal external benefit (MEB) that indicates the increase in external benefits to society from an additional unit of the good:
(75-
The demand curve represents the marginal benefit that accrues to consumers of the good: the marginal private benefit. It does not incorporate the benefits to society as a whole from consuming the good—
With the marginal social benefit curve and the supply curve, we can find the socially optimal quantity of a good or activity that generates external benefits: it is the quantity QOPT that corresponds to point O at which the marginal social benefit equals the marginal cost (as shown by the supply curve). Because the external benefit is not accounted for in market decisions, QMKT is less than QOPT. The yellow deadweight loss area represents the lost opportunities for net gains that could be achieved by producing QOPT rather than QMKT.
So, left to its own, a market will bring about too little production and consumption of a good or activity that generates external benefits. Correspondingly, without government action, the price to consumers of such a good or activity is too high: at the market output level QMKT, the unregulated market price is PMKT and the marginal benefit to consumers of an additional flu shot is lower than PMSB, the true marginal benefit to society of an additional flu shot.
A Pigouvian subsidy is a payment designed to correct for the effects of external benefits.
How can the economy be induced to produce QOPT, the socially optimal level of flu shots shown in Figure 75.3? The answer is by a Pigouvian subsidy: a payment designed to correct for the effects of external benefits. The optimal Pigouvian subsidy, shown in panel (b) of Figure 75.3, is equal to the marginal external benefit of consuming another unit of flu shots. In this example, a Pigouvian subsidy works by lowering the price of consuming the good to PCNS and raising the price producers receive to POPT: consumers pay a price for a flu shot that is equal to the price the producers receive minus the subsidy. In 2001, Japan began a program of subsidizing 71% of the cost of flu shots for the elderly in large cities. A 2005 study found that the subsidy significantly reduced the incidence of pneumonia, and influenza-
A technology spillover is an external benefit that results when new technological knowledge spreads among firms.
The most important single source of external benefits in the modern economy is the creation of knowledge. In high-
Private Versus Social Costs
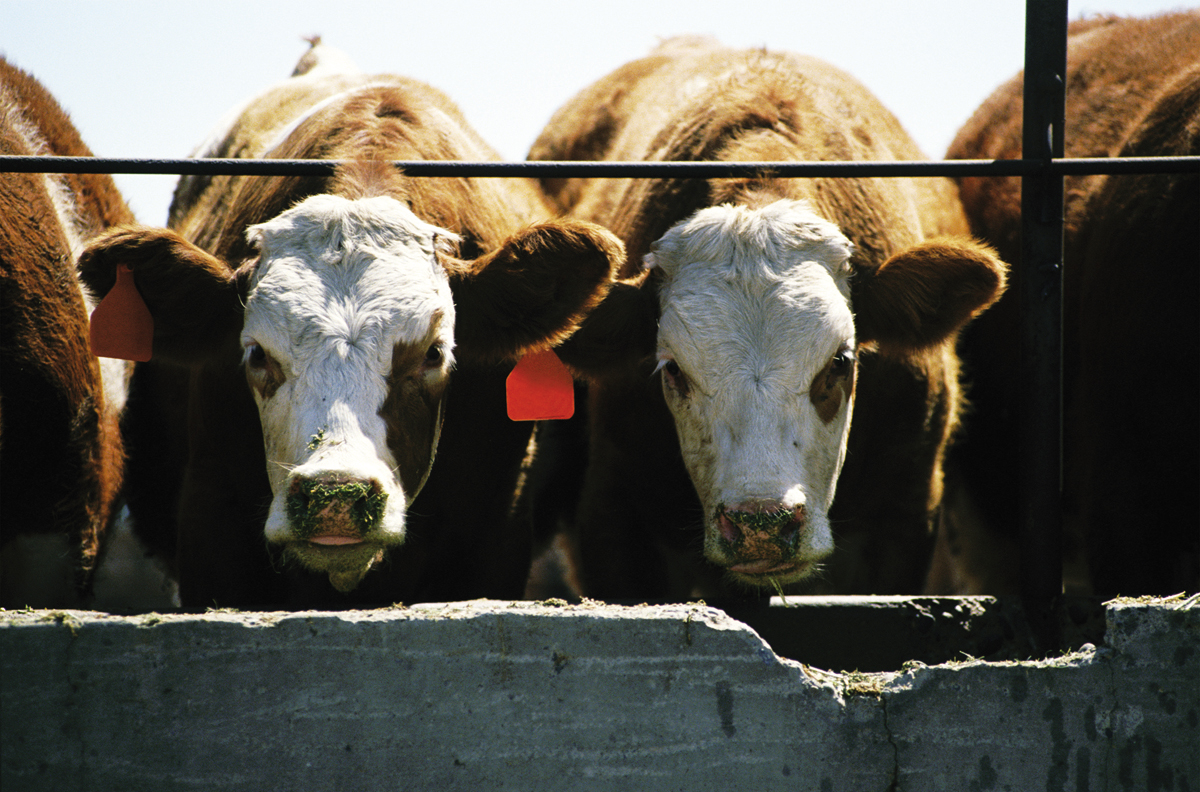
Now let’s turn briefly to consider a case in which production of a good creates external costs—
The marginal private cost of a good is the marginal cost of producing that good, not including any external costs.
The marginal social cost of a good is equal to the marginal private cost of production plus its marginal external cost.
The marginal external cost of a good is the increase in external costs to society created by one more unit of the good.
When a good like pork involves negative externalities, there is a difference between the marginal cost to the firm, which we distinguish as the marginal private cost, and the marginal cost to society, the marginal social cost of a good (or likewise of a service or activity). The difference between the marginal private cost (MPC) and the marginal social cost (MSC) is the marginal external cost (MEC)—the increase in external costs to society from an additional unit of the good:
(75-
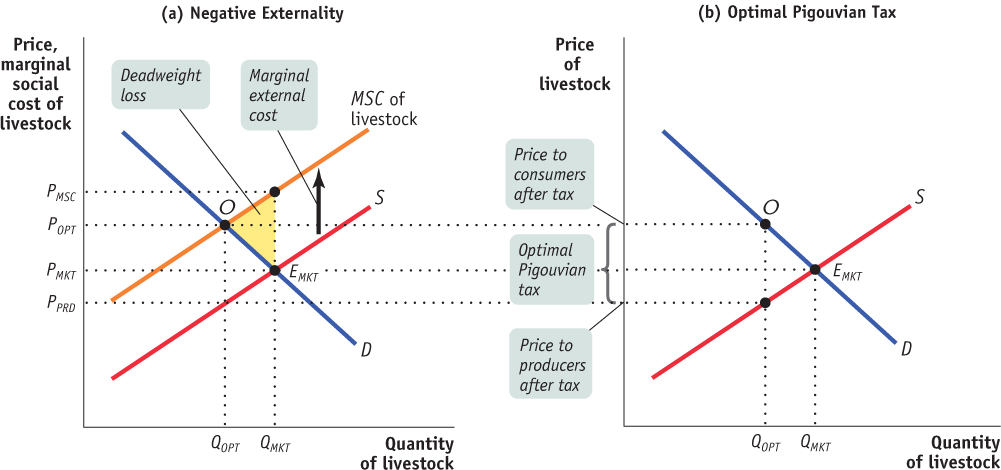
Panel (a) in Figure 75.4 shows the marginal social cost curve, MSC, of livestock; it corresponds to the industry supply curve, S, shifted upward by the amount of the marginal external cost. (Recall that in a competitive industry, the industry supply curve is the horizontal sum of the individual firms’ supply curves, which are the same as their marginal cost curves.) In the absence of government intervention, the market equilibrium will be at point EMKT, yielding an equilibrium quantity of QMKT and an equilibrium price of PMKT.
| Figure 75.4 | Negative Externalities and Production |
The ever-
Unfortunately, the market equilibrium quantity QMKT is greater than QOPT, the socially optimal quantity of livestock. The yellow deadweight loss area represents society’s net losses from producing QOPT rather than QMKT.
AP® Exam Tip
When a positive externality exists, the marginal social benefit curve is above the demand curve. When a negative externality exists, the marginal social cost curve is above the supply curve.
So left to its own, the market produces too much of a good that generates an external cost in production, and the price to consumers of such a good is too low: PMKT is less than PMSC, the true marginal cost to society of another unit of livestock. As panel (b) of Figure 75.4 shows, an optimal Pigouvian tax on livestock production, equal to the marginal external cost, moves the market to the socially optimal level of production, QOPT. The Pigouvian tax works by raising the price paid by consumers to POPT and lowering the price received by producers to PPRD: the consumers pay a price equal to what the producers receive plus the tax.
In the flu shot example, we explained that the socially optimal quantity was found where the MSB and S curves crossed. That point met the MSB = MSC criterion for the socially optimal quantity as well because in the absence of external costs, marginal social cost equals marginal private cost, which is indicated by the supply curve. That is, when MSB = S and there are no external costs, it is also true that MSB = MPC = MSC.
At this point, you might ask whether a regulator would choose a method of control that targets pollution directly, such as a cap and trade program, or would prefer to control the production of the associated good with a Pigouvian tax. Generally, it is a good idea to target the pollution directly whenever feasible. The main reason is that this method creates incentives for the invention and adoption of production methods that create less pollution. For example, the AgCert company has found a way to capture greenhouse gases emitted from animal waste for use as tradable emissions reductions in a cap and trade program.
Network Externalities
There is one type of externality that has no inherently favorable or adverse effect on society at large, but it does affect other users of the associated good or service. Suppose you were the only user of Twitter in the world. What would it be worth to you? The answer, of course, is nothing. Twitter derives its value only from the fact that other people also use Twitter and you can send or receive tweets. In general, the more people who use Twitter, the more valuable it is to you.
A good is subject to a network externality when the value of the good to an individual depends on how many other people also use the good.
A network externality exists when the value to an individual of a good or service depends on how many other people use the same good or service. Sometimes referred to as the “fax machine effect,” the phenomenon of network externalities is so named because the classic examples involve networks of telephones, computers, and transportation systems. When it comes to sharing digital information, it helps to have more users of the same software, hardware, and online networking services. In other contexts, it’s better to have more users of the same stock exchanges, gauges of railroad line, and sizes of electrical plugs, among many examples. Congestion creates a form of negative network externality: it can make things worse for you when more people use the same highway, elevator, or swimming pool.