Tackle the Test: Free-Response Questions
Question
The purchase of antivirus software by one person provides benefits to other people because they are less likely to receive a virus from the software purchaser. Draw a correctly labeled graph showing how the market will determine the quantity of antivirus software purchased. On the same graph, show the socially optimal quantity of antivirus software. Shade and label the area that represents deadweight loss. List two different government policies that could bring about the optimal quantity of antivirus software.
Rubric for FRQ 1 (9 points)
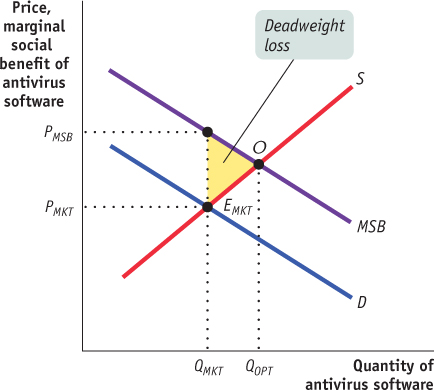
1 point: Vertical axis labeled “Price, marginal social benefit” or “Dollars per unit,” horizontal axis labeled “Quantity of antivirus software” or “Q”
1 point: Upward-
sloping supply (or equivalently, marginal cost) curve. (Note that with no external costs, marginal private cost equals marginal social cost.) 1 point: Downward-
sloping demand (or equivalently, marginal private benefit) curve 1 point: The market quantity of antivirus software is found at the intersection of supply and demand and shown on the horizontal axis.
1 point: Downward-
sloping marginal social benefit curve drawn above demand curve 1 point: The optimal quantity of antivirus software is found at the intersection of supply and marginal social benefit and shown on the horizontal axis.
1 point: The correct deadweight-
loss area is shaded and labeled. 1 point: A Pigouvian subsidy equal to the marginal external benefit at the socially optimal quantity
1 point: A government regulation requiring the optimal quantity of antivirus software
Question
The use of plastic water bottles creates external costs as the result of plastic production, bottle transportation, litter, and waste disposal. Draw a correctly labeled graph showing how the market will determine the quantity of water bottles purchased. On the same graph, show the marginal external cost, the socially optimal quantity of water bottles, and the size of a Pigouvian tax that could be used to achieve the socially optimal quantity of water bottles.(6 points)
Rubric for FRQ 2 (6 points)
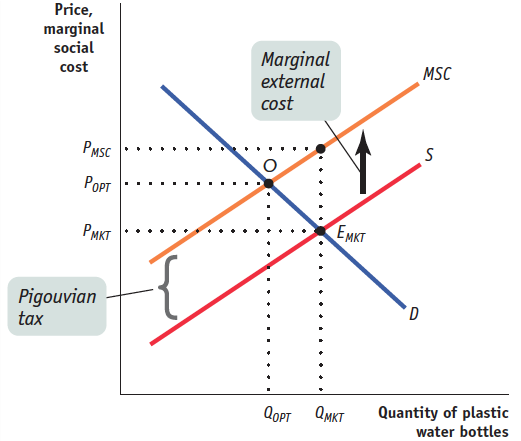
1 point: The vertical axis is labeled “Price, marginal social cost” and the horizontal axis is labeled “Quantity of plastic water bottles” or “Q.”
1 point: The demand curve is downward-sloping and the supply curve is upward-sloping.
1 point: The market quantity is labeled on the horizontal axis directly below the intersection of the demand curve and supply curve.
1 point: The marginal social cost curve is above the supply curve.
1 point: The socially optimal quantity is labeled on the horizontal axis directly below the intersection of the marginal social cost curve and demand curve.
1 point: The Pigouvian tax is labeled as the vertical distance between the supply curve and marginal social cost curve.