Tackle the Test: Free-Response Questions
Question
Draw a correctly labeled graph showing a natural monopoly. On your graph, label the price and quantity the monopoly will choose if unregulated as PU and QU.
On the same graph, shade in and label consumer surplus and the firm’s profit in the absence of regulation.
On the same graph, label the lowest price that regulators could expect the monopoly to maintain in the long run as PR and the resulting quantity as QR.
What happens to the size of consumer surplus when the firm is required to charge PR rather than PU? What happens to the firm’s profit?
Rubric for FRQ 1 (10 points)
Page 769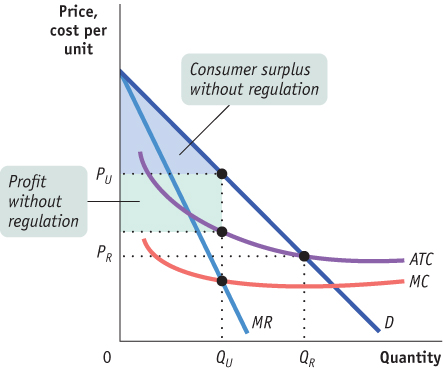
1 point: Correctly labeled axes (“Price, cost per unit” or “Dollars per unit” on the vertical axis, “Quantity” or “Q” on the horizontal axis)
1 point: Downward-
sloping ATC curve 1 point: Downward-
sloping MC curve below the ATC curve 1 point: Unregulated quantity QU shown on the horizontal axis where MC = MR
1 point: Unregulated price PU found on a downward-
sloping demand curve above QU and shown on the vertical axis 1 point: Correct profit rectangle
1 point: Consumer surplus triangle shown below the demand curve and above the price
1 point: Regulated price and quantity PR and QR shown on the appropriate axes, corresponding to where the demand curve crosses the average total cost curve
1 point: Consumer surplus will increase
1 point: Profit will decrease to zero
Question
List and explain three different public policy approaches to monopoly. (6 points)
Rubric for FRQ 2 (6 points)
1 point: Antitrust policy
1 point: Prohibit practices that create monopolies and break up existing monopolies.
1 point: Public ownership
1 point: Have the government operate the monopoly with the goal of efficiency rather than profit.
1 point: Price regulation
1 point: Restrict price to the lowest price that does not cause losses, which is the price at which the average total cost curve intersects the demand curve.