Multiple-Choice Questions
Question
The poverty rate is
A. B. C. D. E. The poverty rate is- Page 786
Question
Which of the following conditions contributes to the resolution of externality problems as suggested by the Coase theorem?
A. B. C. D. E. Which of the following conditions contributes to the resolution of externality problems as suggested by the Coase theorem? Question
When the production of a good creates negative externalities, which of the following leads to the socially optimal quantity of output?
A. B. C. D. E. When the production of a good creates negative externalities, which of the following leads to the socially optimal quantity of output?Question
Which of the following policy changes would be the most likely to provide a gain in efficiency while achieving the same goal of reducing pollution?
A. B. C. D. E. Which of the following policy changes would be the most likely to provide a gain in efficiency while achieving the same goal of reducing pollution?Question
When the economy is producing the socially optimal amount of pollution, it is necessarily true that
A. B. C. D. E. When the economy is producing the socially optimal amount of pollution, it is necessarily true thatQuestion
Market failure caused by a positive externality will involve
A. B. C. D. E. Market failure caused by a positive externality will involveQuestion

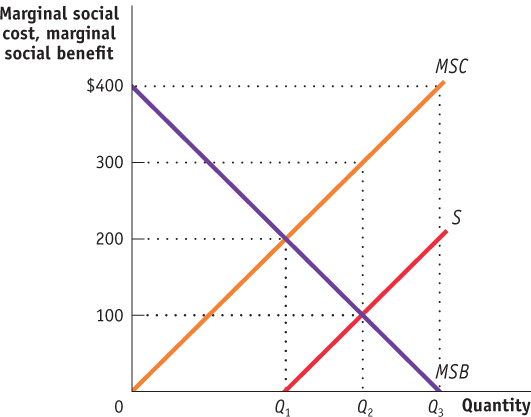
The graph above shows the marginal social cost, supply, and marginal social benefit in an industry that generates pollution. Use this graph to answer Questions 7 and 8.
Suppose the industry is currently producing the quantity Q2 and the price is $100. If a Pigouvian tax equal to the marginal external cost is imposed, what will happen to society’s total surplus and the deadweight loss in the industry?
Total surplusDeadweight lossA. B. C. D. E. The graph above shows the marginal social cost, supply, and marginal social benefit in an industry that generates pollution. Use this graph to answer Questions 7 and 8.Question
The marginal social cost (MSC) and the marginal external cost (MEC) at the socially optimal equilibrium would be
MSCMECA. B. C. D. E. The marginal social cost (- Page 787
Question

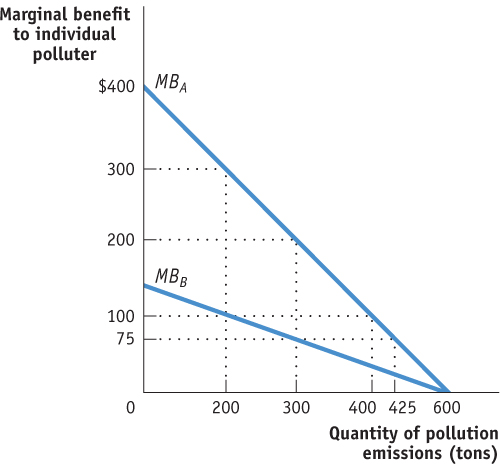
The graph above depicts the marginal benefit of pollution to plants A and B. Currently, each firm is emitting 600 tons of pollution. Use the graph to answer Questions 9 and 10.
An emissions tax of how much per ton would cut the total amount of pollution in half?
A. B. C. D. E. The graph above depicts the marginal benefit of pollution to plants A and B. Currently, each firm is emitting 600 tons of pollution. Use the graph to answer Questions 9 and 10. Question
Instead of using taxes, if the government were to set environmental standards to cut the total amount of pollution in half, what would be the resulting marginal benefits to plants A and B?
Marginal benefit for plant AMarginal benefit for plant BA. B. C. D. E. Instead of using taxes, if the government were to set environmental standards to cut the total amount of pollution in half, what would be the resulting marginal benefits to plants A and B?Question
Which of the following is accurate for goods provided by markets?
A. B. C. D. E. Which of the following is accurate for goods provided by markets?Question
Which of the following is an example of market failure?
A. B. C. D. E. Which of the following is an example of market failure?Question
Which of the following characteristics apply to private goods and common resources?
Private goodsCommon resourcesA. B. C. D. E. Which of the following characteristics apply to private goods and common resources?Question
Based on economic analysis, why do so many people decide not to vote?
A. B. C. D. E. Based on economic analysis, why do so many people decide not to vote?Question
Which of the following statements regarding the passage of laws intended to promote competition in the marketplace is true?
A. B. C. D. E. Which of the following statements regarding the passage of laws intended to promote competition in the marketplace is true?Question
Which of the following statements regarding a natural monopoly is accurate?
A. B. C. D. E. Which of the following statements regarding a natural monopoly is accurate?- Page 788
Question
Which of the following welfare state programs provides in-
kind benefits? A. B. C. D. E. Which of the following welfare state programs provides i Question
Which of the following welfare state programs is not means-
tested? A. B. C. D. E. Which of the following welfare state programs is not meanQuestion
A Gini coefficient of 0.5 would indicate
A. B. C. D. E. A Gini coefficient of 0.5 would indicateQuestion
Which of the following combinations correctly describes the changes since the 1970s in the poverty threshold and in the mean income as compared to the median income in the United States?
Poverty thresholdMean income compared to median incomeA. B. C. D. E. Which of the following combinations correctly describes the changes since the 1970s in the poverty threshold and in the mean income as compared to the median income in the United States?