The Problem of Poverty
For at least the past 75 years, every U.S. president has promised to do his best to reduce poverty. In 1964 President Lyndon Johnson went so far as to declare a “war on poverty,” creating a number of new programs to aid the poor. Antipoverty programs account for a significant part of the U.S. welfare state—the system whereby the government takes responsibility for the welfare of its citizens—although social insurance programs are an even larger part.
The poverty threshold is the annual income below which a family is officially considered poor.
What, exactly, do we mean by poverty? Any definition is somewhat arbitrary. Since 1965, however, the U.S. government has maintained an official definition of the poverty threshold, a minimum annual income that is considered adequate to purchase the necessities of life. Families whose incomes fall below the poverty threshold are considered poor.
The official poverty threshold depends on the size and composition of a family. In 2014 the poverty threshold for an adult living alone was $11,670; for a household consisting of two adults and two children, it was $23,850.
Trends in Poverty
Page 771
Contrary to popular misconceptions, although the official poverty threshold is adjusted each year to reflect changes in the cost of living, it has not been adjusted upward over time to reflect the long-term rise in the standard of living of the average American family. As a result, as the economy grows and becomes more prosperous, and average incomes rise, you might expect the percentage of the population living below the poverty threshold to steadily decline.
The poverty rate is the percentage of the population with incomes below the poverty threshold.
Somewhat surprisingly, however, this hasn’t happened. Figure 78.1 shows the U.S. poverty rate—the percentage of the population living below the poverty threshold—from 1959 to 2012. As you can see, the poverty rate fell steeply during the 1960s and early 1970s. Since then, however, it has fluctuated up and down, with no clear trend. In fact, in 2012 the poverty rate was higher than it had been in 1973.
| Figure 78.1 | Trends in the U.S Poverty Rate, 1959–2012 |
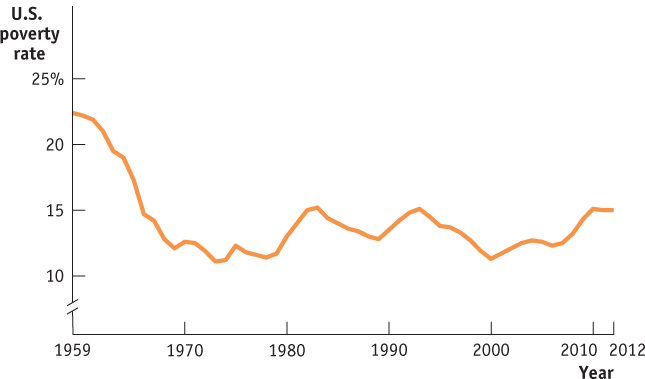
Figure 78.1: Trends in the U.S Poverty Rate, 1959–2012The poverty rate fell sharply from the 1960s to the early 1970s but has not shown a clear trend since then.
Source: U.S. Census Bureau.
Who Are the Poor?
Many Americans probably hold a stereotyped image of poverty: an African-American or Hispanic family with no husband present and the female head of the household unemployed at least part of the time. This picture isn’t completely off-base: poverty is disproportionately high among African-Americans and Hispanics as well as among female-headed households. But a majority of the poor don’t fit the stereotype.
In 2012, about 46.5 million Americans were in poverty—15% of the population, or about one in seven persons. About one-quarter of the poor were African-American and a roughly equal number, Hispanic. Within these two groups, poverty rates were well above the national average: 27.2% of African-Americans and 25.6% of Hispanics. But there was also widespread poverty among non-Hispanic Whites, who had a poverty rate of 9.7%.
Rosemarie Gearhart/iStock/Getty Images
There is also a correlation between family makeup and poverty. Female-headed families with no husband present had a very high poverty rate: 33.9%. Married couples were much less likely to be poor, with a poverty rate of only 6.3%; still, about 39% of poor families were married couples.
What really stands out from the data, however, is the association between poverty and lack of adequate employment. Adults who work full time are very unlikely to be poor: only 2.9% of full-time workers were poor in 2012. Adults who worked part time or not at all during the year made up 85.4% of the poor in 2012. Many industries, particularly in the retail and service sectors, now rely primarily on part-time workers. Part-time work typically lacks benefits such as health plans, paid vacation days, and retirement benefits, and it also usually pays a lower hourly wage than comparable full-time work. As a result, many of the poor are members of what analysts call the working poor: workers whose income falls at or below the poverty threshold.
Page 772
What Causes Poverty?
AP® Exam Tip
Learn the causes of poverty, as they may show up in a question on the multiple choice section of the AP® exam.
Poverty is often blamed on lack of education, and educational attainment clearly has a strong positive effect on income level—on average, those with more education earn higher incomes than those with less education. For example, in 1979 the average hourly wage of men with a college degree was 38% higher than that of men with only a high school diploma; by 2013 the “college premium” had increased to 83%. Lack of proficiency in English is also a barrier to higher income. For example, Mexican-born male workers in the United States—two-thirds of whom have not graduated from high school and many of whom have poor English skills—earn less than half of what native-born men earn. And it’s important not to overlook the role of racial and gender discrimination; although less pervasive today than 50 years ago, discrimination still erects formidable barriers to advancement for many Americans. Non-Whites earn less and are less likely to be employed than Whites with comparable levels of education. Studies find that African-American males suffer persistent discrimination by employers in favor of Whites, African-American women, and Hispanic immigrants. Women earn lower incomes than men with similar qualifications.
In addition, one important source of poverty that should not be overlooked is bad luck. Many families find themselves impoverished when a wage-earner loses a job or a family member falls seriously ill.
Consequences of Poverty
The consequences of poverty are often severe, particularly for children. Currently, 21.8% of children in the United States live in poverty. Poverty is often associated with a lack of access to health care, which can lead to further health problems that erode the ability to attend school and work later in life. Affordable housing is also frequently a problem, leading poor families to move often and disrupting school and work schedules. Recent medical studies have shown that children raised in severe poverty tend to suffer from lifelong learning disabilities. As a result, American children growing up in or near poverty don’t have an equal chance at the starting line: they tend to be at a disadvantage throughout their lives. For example, even talented children who come from poor families are unlikely to finish college.
Table 78.1 shows the results of a long-term survey conducted by the U.S. Department of Education, which tracked a group of students who were in eighth grade in 1988. That year, the students took a mathematics test that the study used as an indicator of their innate ability; the study also scored students by the socioeconomic status of their families, a measure that took into account their parents’ income and employment. As you can see, the results were disturbing: only 29% of students who were in the highest-scoring 25% on the test but whose parents were of low status finished college. By contrast, the equally talented children of high-status parents had a 74% chance of finishing college—and children of high-status parents had a 30% chance of finishing college even if they had low test scores. What this tells us is that poverty, to an important degree, is self-perpetuating: the children of the poor start at such a disadvantage relative to other Americans that it’s very hard for them to achieve a better life.
Table 78.1Percent of Eighth-Graders from 1988 who Finished College
|
Mathematics test score in bottom quartile |
Mathematics test score in top quartile |
| Parents in bottom quartile |
3% |
29% |
| Parents in top quartile |
30 |
74 |
|
Source: National Center for Education Statistics, The Condition of Education 2003, p. 47. |
Table 78.1: Table 78.1 Percent of Eighth-Graders from 1988 who Finished College
Page 773
The Impeccable Economic Logic of Early-Childhood Intervention Programs
The Impeccable Economic Logic of Early-Childhood Intervention Programs
One of the most vexing problems facing any society is how to break what researchers call the “cycle of poverty”: children who grow up with disadvantaged socioeconomic backgrounds are far more likely to remain trapped in poverty as adults, even after we account for differences in ability. They are more likely to be unemployed or underemployed, to engage in crime, and to suffer chronic health problems.
Early childhood intervention has offered some hope of breaking the cycle. A 2006 study by the RAND Corporation found that high-quality early-childhood programs that focus on education and health care lead to significant social, intellectual, and financial advantages for kids who would otherwise be at risk of dropping out of high school and of engaging in criminal behavior. Children in programs like Head Start were less likely to engage in such destructive behaviors and more likely to end up with a job and to earn a high salary later in life. Another study by researchers at the University of Pittsburgh in 2003 looked at early-childhood intervention programs from a dollars-and-cents perspective, finding from $4 to $7 in benefits for every $1 spent on early-childhood intervention programs. The study also pointed to one program whose participants, by age 20, were 26% more likely to have finished high school, 35% less likely to have been charged in juvenile court, and 40% less likely to have repeated a grade compared to individuals of similar socioeconomic background who did not attend preschool. The observed external benefits to society of these programs are so large that the Brookings Institution predicts that providing high-quality preschool education to every American child would result in an increase in GDP, the total value of a country’s domestic output, by almost 2%, representing over 3 million more jobs.