Tackle the Test: Free-Response Questions
Question
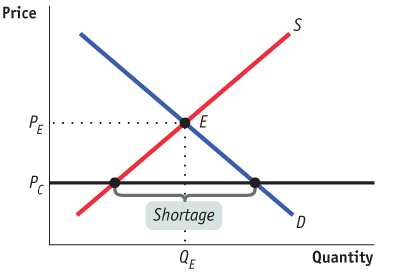
Draw a correctly labeled graph showing the market for tomatoes in equilibrium. Label the equilibrium price “PE” and the equilibrium quantity “QE.” On your graph, draw a horizontal line indicating a price, labeled “PC”, that would lead to a shortage of tomatoes. Label the size of the shortage on your graph.
Rubric for FRQ 1 (6 points)
1 point: Graph with the vertical axis labeled “Price” or “P” and the horizontal axis labeled “Quantity” or “Q”
1 point: Downward-
sloping demand curve labeled “Demand” or “D” 1 point: Upward-
sloping supply curve labeled “Supply” or “S” 1 point: Equilibrium price “PE” labeled on the vertical axis and quantity “QE” labeled on the horizontal axis at the intersection of the supply and demand curves
1 point: Price line at a price “PC” below the equilibrium price
1 point: Correct indication of the shortage, which is the horizontal distance between the quantity demanded and the quantity supplied at the height of PC
Question
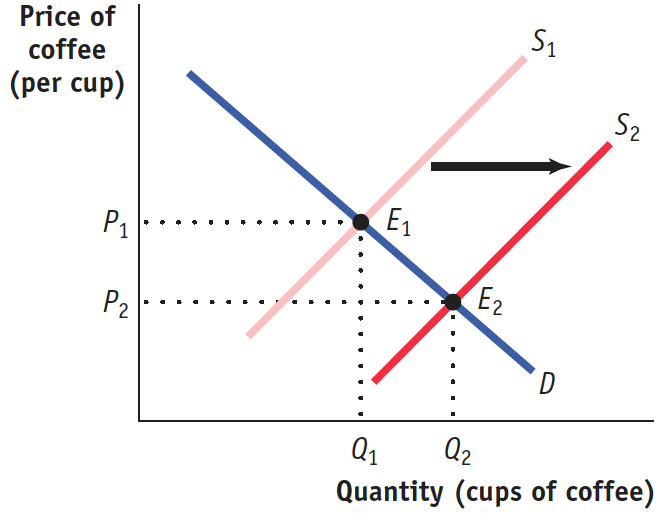
Draw a correctly labeled graph showing the market for cups of coffee in equilibrium. On your graph, show the effect of a decrease in the price of coffee beans on the equilibrium price and the equilibrium quantity in the market for cups of coffee.
(5 points)
Rubric for FRQ 2 (5 points)
1 point: The vertical axis is labeled “Price” and the horizontal axis is labeled “Quantity.”
1 point: Upward-sloping and labeled “ Supply curve” and downward-sloping and labeled “ Demand curve.”
1 point: Equilibrium price and quantity are shown on the axes.
1 point: An upward-sloping and labeled supply curve is shown to the right of the original supply curve.
1 point: The new equilibrium price and quantity are shown on the axes.