Tackle the Test: Free-Response Questions
Question
Refer to the graph provided to answer the following questions.
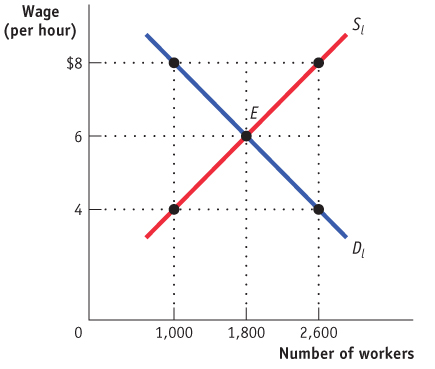
What are the equilibrium wage and quantity of workers in this market?
For it to have an effect, where would the government have to set a minimum wage?
If the government set a minimum wage at $8,
how many workers would supply their labor?
how many workers would be hired?
how many workers would want to work that did not want to work for the equilibrium wage?
how many previously employed workers would no longer have a job?
Rubric for FRQ 1 (6 points)
1 point: equilibrium wage = $6, quantity of labor = 1,800
1 point: The minimum wage will have an effect if it is set anywhere above $6.
1 point: 2,600 workers would supply their labor
1 point: 1,000 workers would be hired
1 point: 800 (the number of workers who would want to work for $8 but did not supply labor for $6)
1 point: 800 (at the equilibrium wage of $6, 1,800 workers were hired; at a wage of $8, 1,000 workers would be hired. 1,800 – 1,000 = 800)
Question
Draw a correctly labeled graph of a housing market in equilibrium. On your graph, illustrate an effective legal limit (ceiling) on rent. Identify the quantity of housing demanded, the quantity of housing supplied, and the size of the resulting surplus or shortage. (6 points)
Rubric for FRQ 2 (6 points)
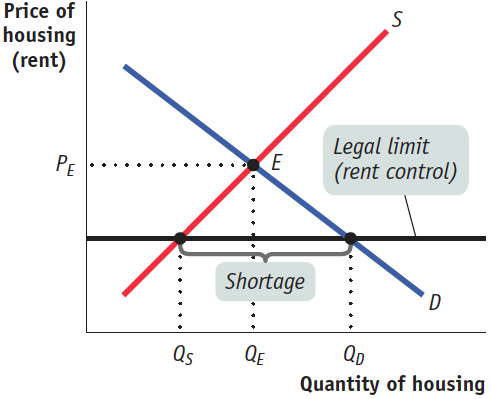
1 point: Vertical axis is labeled “Price,” horizontal axis is labeled “Quantity,” demand curve is downward-sloping and labeled, supply curve is upward-sloping and labeled.
1 point: Equilibrium price and quantity are shown on the axes.
1 point: Price ceiling is shown as a horizontal line below equilibrium.
1 point: Showing QD at the price ceiling on the demand curve
1 point: Showing QS at the price ceiling on the supply curve
1 point: Showing a shortage equal to the distance between QD and QS