Printed Page 97
Check Your Understanding
Question
Suppose that the supply and demand for taxi rides is given by Figure 9.1 and a quota is set at 6 million rides. Replicate the graph from Figure 9.1, and identify each of the following on your graph:
the price of a ride
The price of a ride is $7 since the quantity demanded at this price is 6 million: $7 is the demand price of 6 million rides. This is represented by point A in the accompanying figure.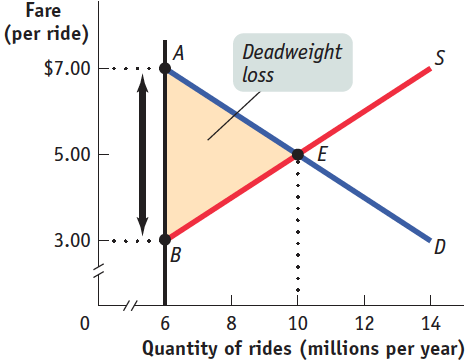
the quota rent
At 6 million rides, the supply price is $3 per ride, represented by point B in the figure. The wedge between the demand price of $7 per ride and the supply price of $3 per ride is the quota rent per ride, $4. This is represented in the figure above by the vertical distance between points A and B.the deadweight loss resulting from the quota.
The quota discourages 4 million mutually beneficial transactions. The shaded triangle in the figure represents the deadweight loss.Suppose the quota on taxi rides is increased to 9 million.
What happens to the quota rent and the deadweight loss?
At 9 million rides, the demand price is $5.50 per ride, indicated by point C in the figure below, and the supply price is $4.50 per ride, indicated by point D. The quota rent is the difference between the demand price and the supply price: $1. The deadweight loss is represented by the shaded triangle in the figure. As you can see, the deadweight loss is smaller when the quota is set at 9 million rides than when it is set at 6 million rides.
Question
Again replicate the graph from Figure 9.1. Suppose that the quota is 8 million rides and that demand decreases due to a decline in tourism. Show on your graph the smallest parallel leftward shift in demand that would result in the quota no longer having an effect on the market.
The accompanying figure shows a decrease in demand by 4 million rides, represented by a leftward shift of the demand curve from D1 to D2: at any given price, the quantity demanded falls by 4 million rides. (For example, at a price of $5, the quantity demanded falls from 10 million to 6 million rides per year.) This eliminates the effect of a quota limit of 8 million rides. At point E2, the new market equilibrium, the equilibrium quantity is equal to the quota limit; as a result, the quota has no effect on the market.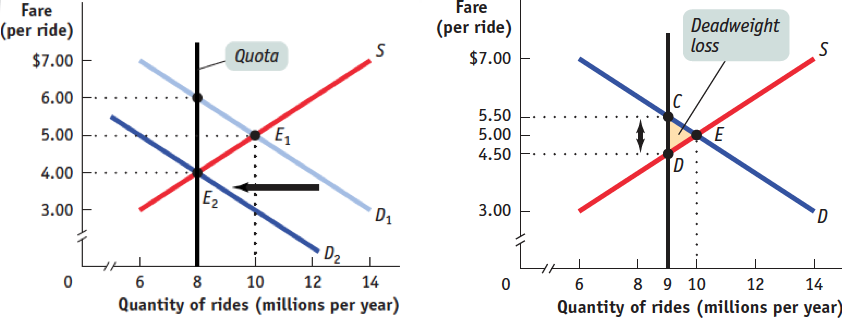
[Leave] [Close]