Tackle the Test: Free-Response Questions
Question
Draw a correctly labeled graph illustrating hypothetical supply and demand curves for the U.S. automobile market. Label the equilibrium price and quantity. Suppose the government institutes a quota to limit automobile production. Draw a vertical line labeled “Qineffective” to show the level of a quota that would have no effect on the market. Draw a vertical line labeled “Qeffective” to show the level of a quota that would have an effect on the market. Shade in and label the deadweight loss resulting from the effective quota.
Rubric for FRQ 1 (5 points)
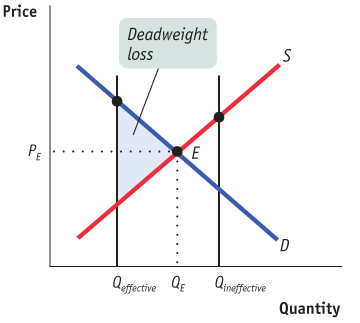
1 point: Correctly labeled supply and demand diagram (vertical axis labeled “Price” or “P,” horizontal axis labeled “Quantity” or “Q,” upward-
sloping supply curve with label, downward- sloping demand curve with label) 1 point: Equilibrium at the intersection of supply and demand with the equilibrium price labeled on the vertical axis and the equilibrium quantity labeled on the horizontal axis
1 point: Vertical line to the right of equilibrium quantity labeled Qineffective
1 point: Vertical line to the left of equilibrium quantity labeled Qeffective
1 point: The triangle to the right of the effective quota line and to the left of supply and demand shaded in and labeled as the deadweight loss
Question
Draw a correctly labeled graph of the market for taxicab rides. On the graph, draw and label a vertical line showing the level of an effective quota. Label the demand price, the supply price, and the quota rent. (6 points)
Rubric for FRQ 2 (6 points)
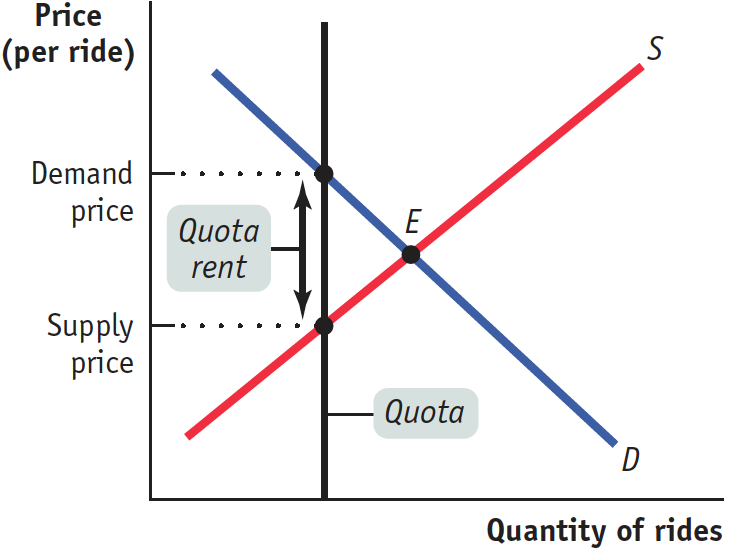
1 point: Correctly labeled supply and demand diagram (vertical axis labeled “Price”P or “P,” horizontal axis labeled “Quantity” or “Q,“ upwardsloping supply curve with label, downwardsloping demand curve with label)
1 point: Equilibrium price and quantity are shown on the axes.
1 point: Quota is shown as a vertical line to the left of equilibrium.
1 point: Showing demand price on the vertical axis at the level where the quota intersects the demand curve
1 point: Showing supply price on the vertical axis at the level where the quota intersects the supply curve
1 point: Showing the quota rent as the difference between demand price and supply price