Check Your Understanding
Question
The accompanying table shows Samantha’s preferences for consumption bundles composed of chocolate kisses and licorice drops.
Consumption bundle Quantity of chocolate kisses Quantity of licorice drops Total utility (utils) A 1 3 6 B 2 3 10 C 3 1 6 D 2 1 4 With chocolate kisses on the horizontal axis and licorice drops on the vertical axis, draw hypothetical indifference curves for Samantha and locate the bundles on the curves. Assume that both items are ordinary goods.
As you can see from the accompanying diagram, the four bundles are associated with three indifference curves: B on the 10-util indifference curve, A and C on the 6-util indifference curve, and D on the 4-util indifference curve.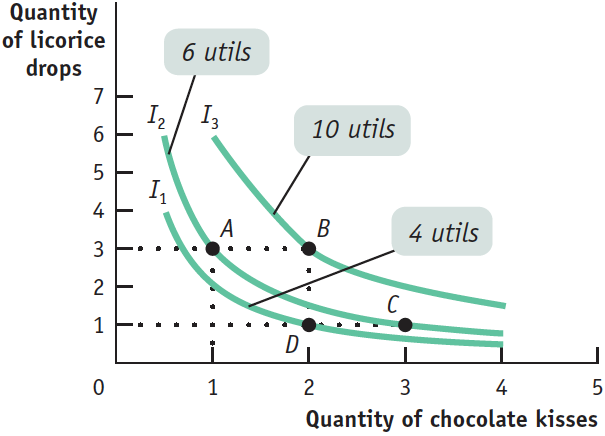
Suppose you don’t know the number of utils provided by each bundle. Assuming that more is better, predict Samantha’s ranking of each of the four bundles to the extent possible. Explain your answer.
From comparing the quantities of chocolate kisses and licorice drops, you can predict that Samantha will prefer B to A because B gives her one more chocolate kiss and the same number of licorice drops as A. Next, you can predict that she will prefer C to D because C gives her one more chocolate kiss and the same number of licorice drops as D . You can also predict that she will prefer B to D because B gives her two more licorice drops and the same number of chocolate kisses as D . But without data about utils, you cannot predict how Samantha would rank A versus C or D because C and D have more chocolate kisses but fewer licorice drops than A . Nor can you rank B versus C , for the same reason.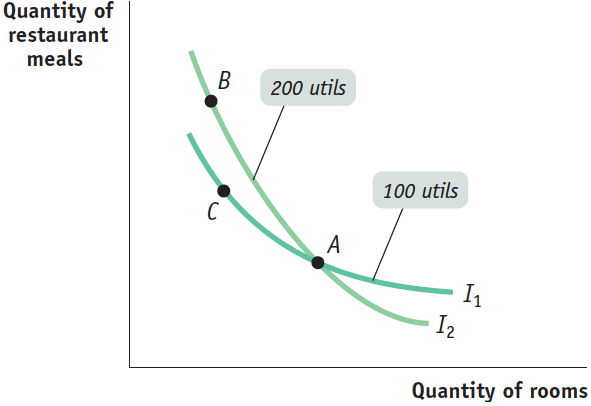
Question
On the left diagram in panel (a) of Figure D.4, draw a point B anywhere on the 200-
util indifference curve and a point C anywhere on the 100- util indifference curve (but not at the same location as point A). By comparing the utils generated by bundles A and B and those generated by bundles A and C, explain why indifference curves cannot cross. Bundles A and B each generate 200 utils since they both lie on the 200-util indifference curve. Likewise, bundles A and C each generate 100 utils since they both lie on the 100-util indifference curve. But this implies that A generates 100 utils and also that A generates 200 utils. This is a contradiction and so cannot be true. Therefore, indifference curves cannot cross.Question
Lucinda and Kyle each consume 3 comic books and 6 video games. Lucinda’s marginal rate of substitution of books for games is 2 and Kyle’s is 5.
For each person, find another consumption bundle that yields the same total utility as the current bundle. Who is less willing to trade games for books? In a diagram with books on the horizontal axis and games on the vertical axis, how would this be reflected in differences in the slopes of their indifference curves at their current consumption bundles?
The marginal rate of substitution of books for games, MUB / MUG , is 2 for Lucinda and 5 for Kyle. This implies that Lucinda is willing to trade 1 more book for 2 fewer games and Kyle is willing to trade 1 more book for 5 fewer games. So starting from a bundle of 3 books and 6 games, Lucinda would be equally content with a bundle of 4 books and 4 games and Kyle would be equally content with a bundle of 4 books and 1 game. Lucinda fi nds it more diffi cult to trade games for books: She is willing to give up only 2 games for a book, but Kyle is willing to give up 5 games for a book. If books are measured on the horizontal axis and games on the vertical axis, Kyle’s indifference curve will be steeper than Lucinda’s at the current consumption bundle.Find the relative price of books in terms of games at which Lucinda’s current bundle is optimal. Is Kyle’s bundle optimal given this relative price? If not, how should Kyle rearrange his consumption?
Lucinda’s current consumption bundle is optimal if PB / PG , the relative price of books in terms of games, is 2. Kyle’s current consumption bundle is not optimal at this relative price; his bundle would be optimal only if the relative price of books in terms of games were 5. Since, for Kyle, MUB /MUG = 5, if PB/PG = 2, he should consume fewer games and more books to lower his MUB/MUG until it is equal to 2.
We provide these review questions in addition to discussion starters in case you or the AP® program chooses a rigorous approach to this material.