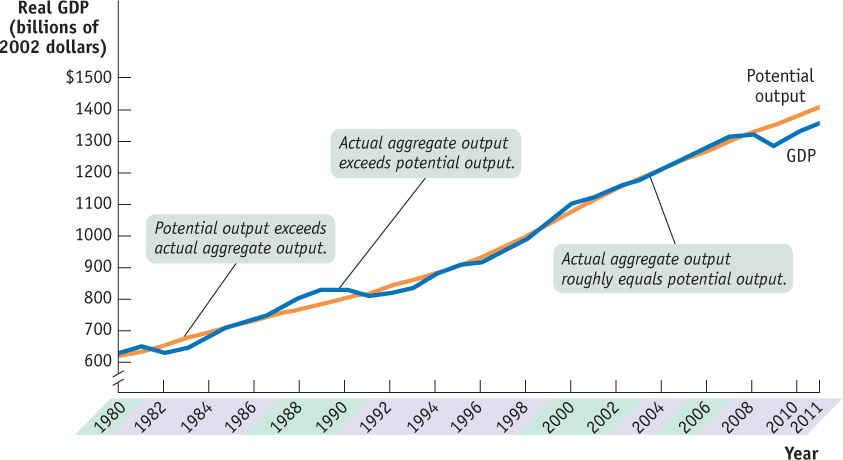
Figure12-8Actual and Potential Output from 1980 to 2011 This figure shows Canada’s actual aggregate output and potential output from 1980 to 2011. The orange line shows the estimates of potential output made by the office of the Parliamentary Budget Officer. The blue line shows actual aggregate output. The purple- n-
Sources: Parliamentary Budget Officer (PBO); Statistics Canada.
Sources: Parliamentary Budget Officer (PBO); Statistics Canada.