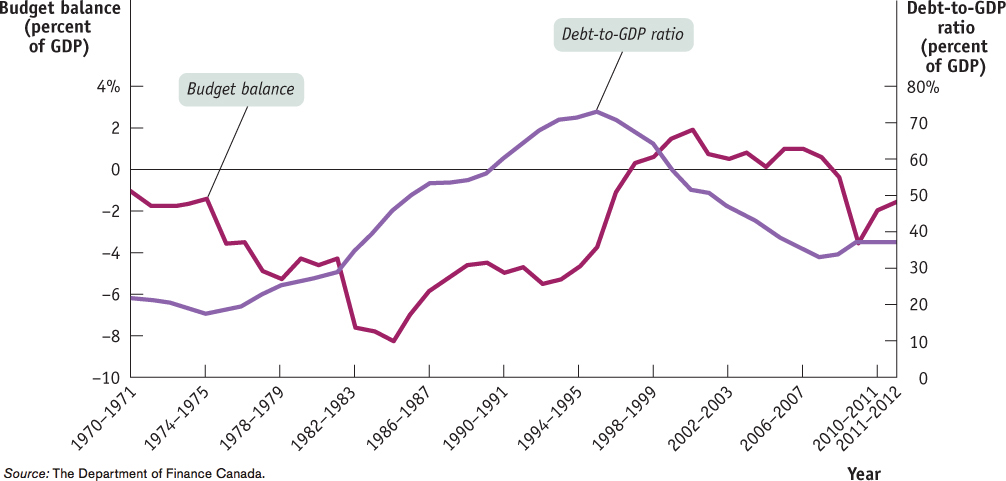
Figure13-11Canada’s Federal Deficits and Debt The burgundy curve shows Canada’s federal budget balance as a percentage of GDP from 1970 to 2012. The Canadian government ran budget deficits until the mid- 1990s. When the government lowered its spending to address the national debt problem, the deficits became surpluses. The government began to run deficits again during the recession of 2008–2009. The purple curve shows Canada’s (net federal) debt- to- GDP ratio. Comparing the curves, you can see that the debt- to- GDP ratio often rose when there were budget deficits. The ratio fell when the deficits became surpluses.
Source: The Department of Finance Canada.
Source: The Department of Finance Canada.
[Leave] [Close]