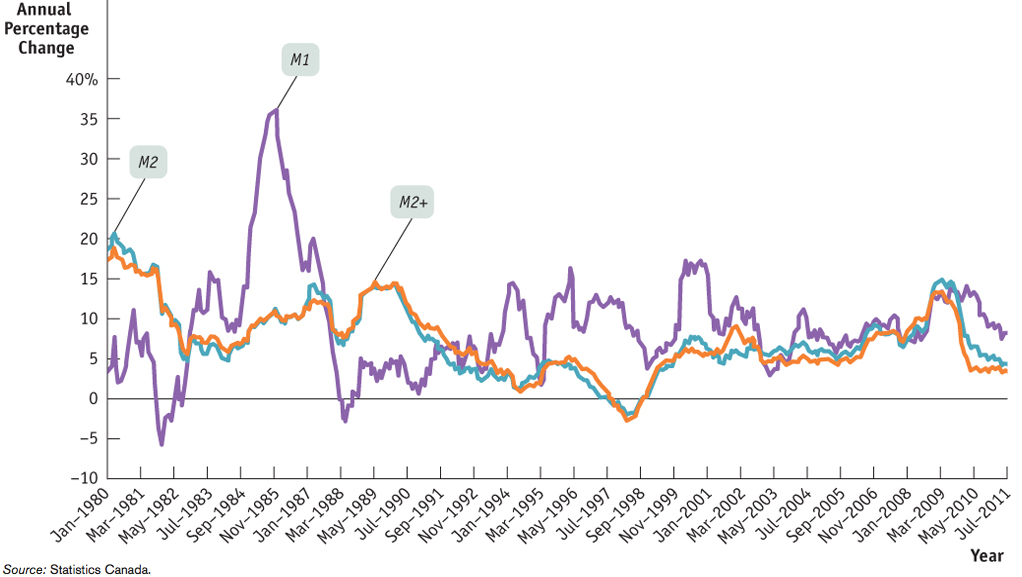
Figure14-11Annual Growth Rates of M1, M2, and M2+, January 1980 to July 2011 The annual growth rates of M1, M2, and M2+ are shown for the period between January 1980 and July 2011. This shows that, at any given time, it is possible for these monetary aggregates to be moving quite differently, including in different directions. Source: Statistics Canada.
[Leave] [Close]