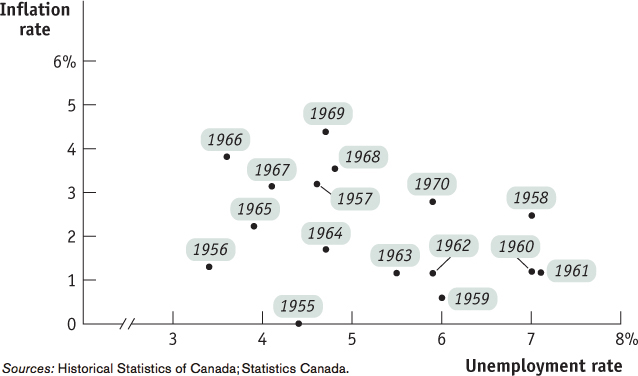
Figure16-5Unemployment and Inflation, 1955–1970 Each point shows the average Canadian unemployment rate for one year and the percentage change in the consumer price index over the subsequent year. Data like these lay behind the initial concept of the Phillips curve.
Sources: Historical Statistics of Canada; Statistics Canada.
Sources: Historical Statistics of Canada; Statistics Canada.
[Leave] [Close]