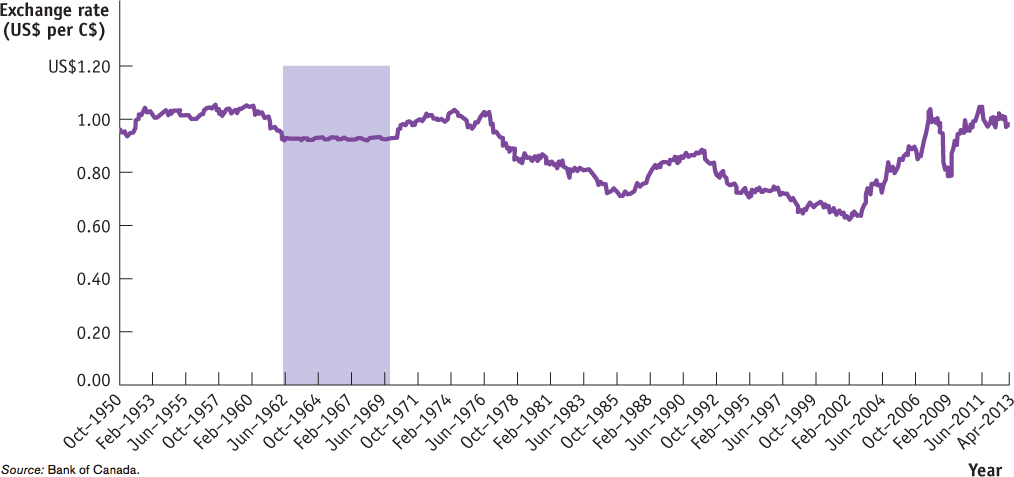
Figure19-11Monthly Average Canada–U.S. Exchange Rate, October 1950–April 2013 This graph plots the monthly average value of the Canada– U.S. exchange rate from October 1950 until April 2013. The exchange rate is quoted as the number of U.S. dollars that can be bought with one Canadian dollar. The shaded area shows when the Canadian dollar exchange rate was fixed against the U.S. dollar from 1962 to 1970. The Canadian dollar was allowed to float in value from 1950 to 1962 and again starting in 1970. Source: Bank of Canada.
[Leave] [Close]