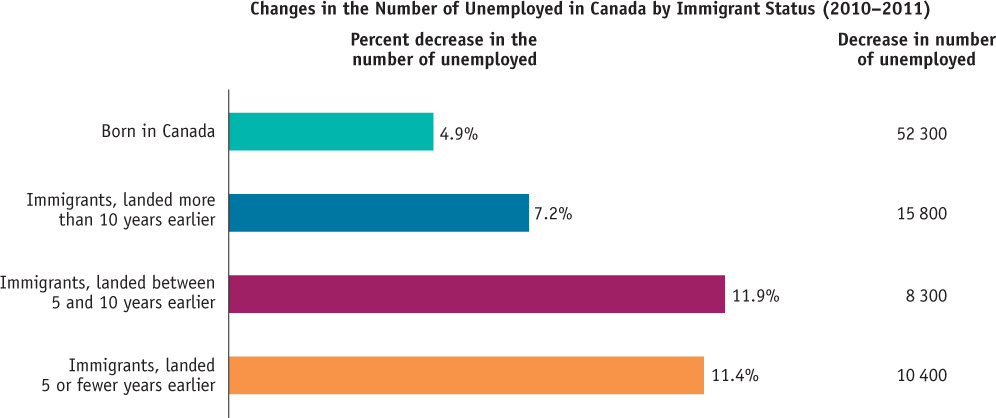
Figure2-17Bar Graph A bar graph measures a variable by using bars of various heights or lengths. This bar graph shows the percent decrease in the number of unemployed workers in Canada between 2010 and 2011 by different immigrant status.
Source: Statistics Canada.
Source: Statistics Canada.