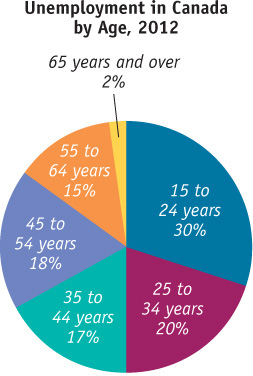
Figure2A- 10 Pie Chart A pie chart shows the percentages of a total amount that can be attributed to various components. This pie chart shows the percentage of the unemployed in Canada in 2012 by age group. Source: Statistics Canada.
[Leave] [Close]