TABLE
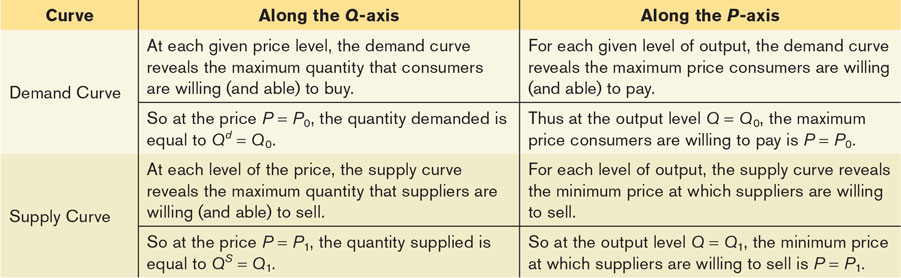
3
A-
3
: Interpreting Points along Demand and Supply Curves
[
Leave
] [
Close
]
Next