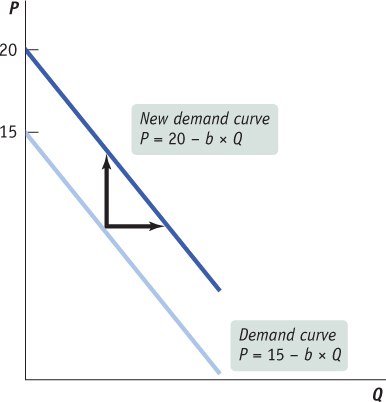
Figure18Figure 3A-1: Shifts of the Demand Curve According to geometry, if the value of a increases, then the demand curve should shift up. But in economics, an increase in the value of a leads to an increase in demand, which shifts the demand curve to the right. Both interpretations are correct because the new demand curve is shifted to the right and shifted up. In this diagram, the value of a changes from 15 to 20.
Note that if demand decreases (i.e., a decreases), the demand curve shifts down (or to the left).
Note that if demand decreases (i.e., a decreases), the demand curve shifts down (or to the left).