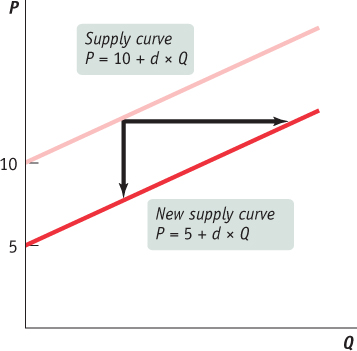
Figure19Shifts of the Supply Curve As with the demand curve in Figure 3A-1, there are two ways to interpret a shift in the supply curve. In economics, a decrease in the value of c represents an increase in supply, which shifts the supply curve to the right. The shift right can also be seen as a shift down because the constant term decreased. In this diagram, the value of c changes from 10 to 5.
Note that if supply decreases (i.e., c increases), the supply curve shifts up (or to the left).
Note that if supply decreases (i.e., c increases), the supply curve shifts up (or to the left).