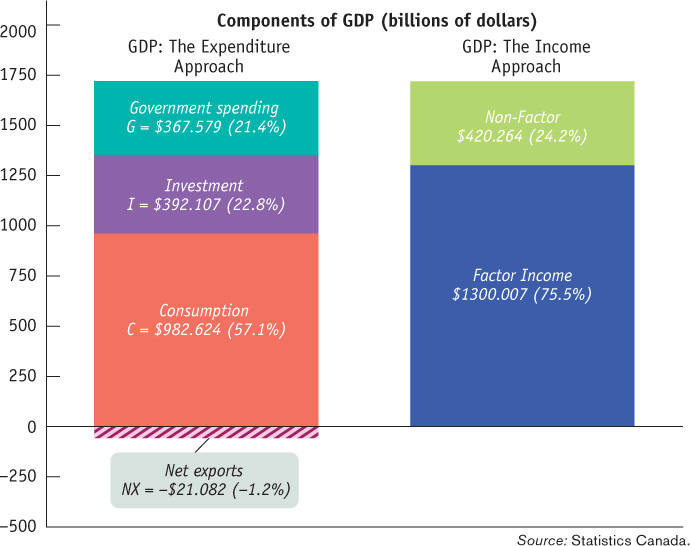
Figure7-3Canada’s GDP in 2011: Two Methods of Calculating GDP The two bars show two equivalent ways to calculate GDP. The height of each bar above the horizontal axis represents $1720.748 billion, Canada’s GDP in 2011. The bar on the left shows Canada’s GDP calculated according to the expenditure approach, with the sources of expenditures being consumption, investment, government spending, and net exports. The $21 billion, shown as the area extending below the horizontal axis, is the amount of total spending absorbed by net exports, which means Canada ran a trade deficit in 2011.
The bar on the right shows Canada’s GDP according to the income approach, with the sources of income being factor incomes and non- factor payments. Factor incomes include wages, salaries, and supplementary labour income ($889.487 billion, 51.7%); corporation profits, including government enterprises ($255.139 billion, 13.1%), interest, and miscellaneous investment income ($73.794 billion, 4.3%); and unincorporated profits, including rent ($111.587 billion, 6.5%). Non- factor payments include indirect taxes, net of subsidies ($179.980 billion, 10.5%), inventory valuation adjustment (−$1.389 billion, −0.1%), and capital consumption allowances ($241.673 billion, 14.0%).
The bar on the right shows Canada’s GDP according to the income approach, with the sources of income being factor incomes and no
[Leave] [Close]