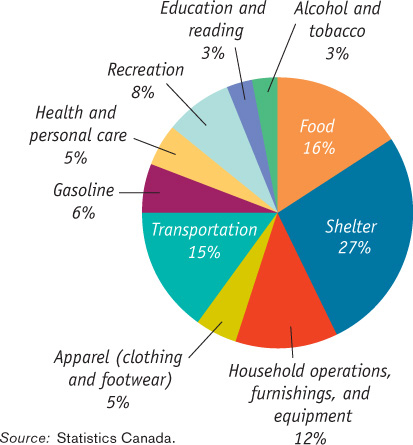
Figure7-6The Makeup of the Consumer Price Index in 2011 This chart shows the percentage shares of major types of spending in the CPI as of April 2011 (using the 2009 basket at April 2011 prices). Housing (shelter & household operations), food, transportation, and gasoline comprised about 76% of the CPI 2009 market basket.
[Leave] [Close]