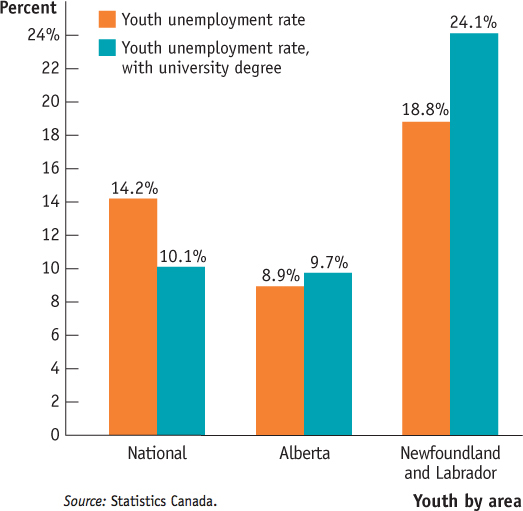
Figure8-3Unemployment Rates for Different Groups and Regions, August 2012 This graph shows that unemployment rates can differ by group and by region. For example, in August 2012, the unemployment rate for youth in Alberta was less than half that of youth in Newfoundland and Labrador. So, even during periods of low overall unemployment, unemployment remains a serious problem for some groups. Note that even though youths from Alberta and Newfoundland and Labrador had a higher rate of unemployment if they had a university degree, the situation is just the reverse nationally.
Source: Statistics Canada.
Source: Statistics Canada.
[Leave] [Close]