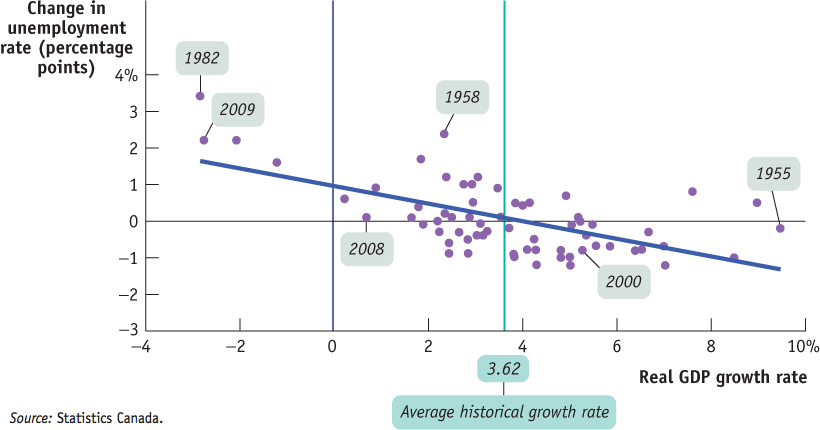
Figure8-5Growth and Changes in Unemployment, 1946–2010 Each dot shows the growth rate of the economy and the change in the unemployment rate for a specific year between 1946 and 2010. For example, in 2000, the economy grew 5.2% and the unemployment rate fell 0.8 of a percentage point, from 7.6% to 6.8%. In general, unemployment fell when growth was above its average rate of 3.62% a year and rose when growth was below average. Unemployment always rose when real GDP fell.
Source: Statistics Canada.
Source: Statistics Canada.
[Leave] [Close]