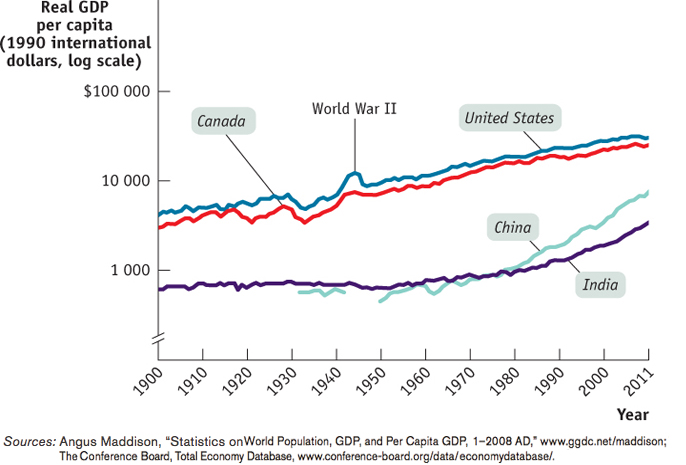
Figure9-1Economic Growth in Canada, the United States, India, and China over the Past Century Real GDP per capita from 1900 to 2011, measured in 1990 international dollars, is shown for Canada, the United States, India, and China. Equal percent changes in real GDP per capita are drawn the same size. As the steeper slopes of the lines representing China and India show, since 1980 India and China had a much higher growth rate than Canada and the United States. In 1995, China attained the standard of living achieved in Canada in 1900. In 2011, India still had not attained the standard of living Canadians had in 1900. (Break in China data from 1940 to 1950 is due to war.)
Sources: Angus Maddison, “Statistics on World Population, GDP, and Per Capita GDP, 1–2008 AD,” www.ggdc.net/maddison; The Conference Board, Total Economy Database, www.conference- board.org/data/economydatabase/ .
Sources: Angus Maddison, “Statistics on World Population, GDP, and Per Capita GDP, 1–2008 AD,” www.ggdc.net/maddison; The Conference Board, Total Economy Database, www.conferenc
[Leave] [Close]