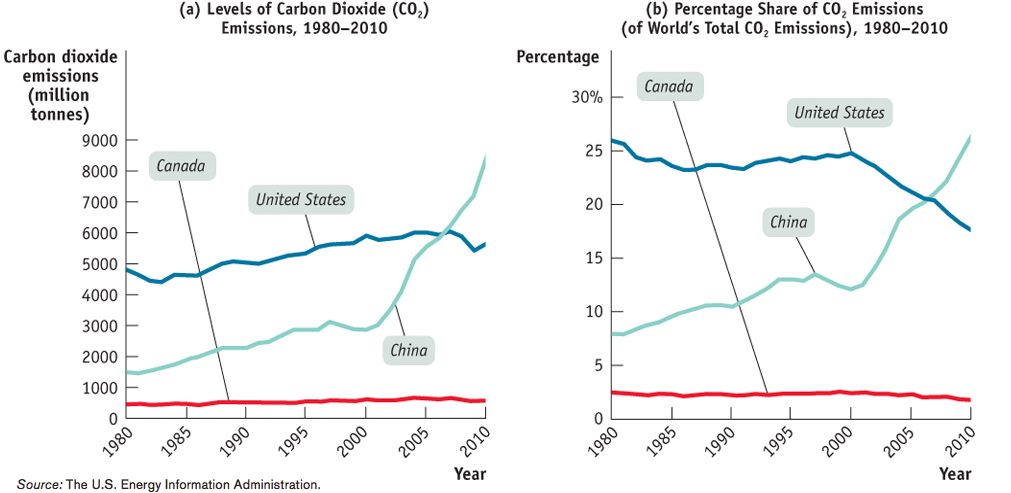
Figure9-15Climate Change and Growth Greenhouse gas emissions are related positively to economic growth. Panel (a) shows the levels of CO2 emissions by Canada, the United States, and China from 1980 to 2010. Developed countries have more complex industries and more vehicles in use, plus they consume more non- essential items than less developed countries do. Consequently, developed countries produce far more greenhouse gas emissions. As the economies of China and other emerging nations begin to grow more quickly, these countries will also begin to emit even more CO2 than they do now. As Panel (b) shows, in recent years China has emitted a greater percent of the world’s total CO2 than the U.S., and hence more CO2 than the United States, largely as a result of China’s rapid transformation over the past three decades into the world’s factory. In 2010, China produced about 26% of the world’s CO2 emissions. We can also look at the level of CO2 emission on a per capita basis. According to the World Bank, in 2008, the average CO2 emission per capita was 4.76 tonnes for the world as a whole. China, Canada, and the U.S. were all above the world average in this regard. China produced 5.31 tonnes per capita, Canada produced 16.33 tonnes per capita, and the U.S. produced 17.96 tonnes per capita.
Source: The U.S. Energy Information Administration.
Source: The U.S. Energy Information Administration.
[Leave] [Close]