Market Equilibrium
Along the demand curve, all consumers have voluntarily chosen how much to buy at each specific price to maximize their level of utility or satisfaction. Similarly, along the supply curve all suppliers have voluntarily chosen the quantity they are willing to sell at each specific price to maximize their level of profit. Recall that the market equilibrium occurs where the demand and supply curves intersect. At this intersection, the market outcome is efficient—

In the same way we find the intersection of two lines in geometry, we can determine the equilibrium quantity by equating the supply and demand curves. At equilibrium, PS and Pd should both be equal to the equilibrium price, P*. Likewise, QS and Qd should both be equal to the equilibrium quantity, Q*. So in our maple syrup example, we can say:

and solve for Q*:

Knowing that the equilibrium quantity is 27 million litres per year, we can now determine the equilibrium price using either the demand curve or the supply curve:
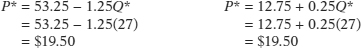
The equilibrium price is $19.50 per litre of maple syrup.
Since the market is based on voluntary exchanges at the equilibrium point (Q*, P*), it is not possible to make either consumers (buyers) or suppliers (sellers) better off without making the other group worse off. For example, consumers would like to buy more maple syrup at a lower price per litre, as this would raise their level of utility or satisfaction. The problem with this is that such a move would result in a reduction in the profits of suppliers, which makes them worse off. Neither group would voluntarily do something that would harm themselves. Thus once we have arrived at the equilibrium intersection, this outcome is a stable situation—