15.1 The Demand for Money
In Chapter 14 we learned about the various types of monetary aggregates: M1, the narrowest definition of the money supply, consists of currency in circulation (cash) plus chequeable (demand) deposits at chartered banks. M1+, the next broadest definition, consists of M1 plus the demand deposits at trust companies, mortgage and loan companies, credit unions, and caisses populaires. M2, the next step up, consists of M1 plus personal term deposits and non-
The Opportunity Cost of Holding Money
Most economic decisions involve trade-
Non-monetary assets are assets that are not made up of money, nor function as money.
Individuals and firms find it useful to hold some of their assets in the form of money because of the convenience money provides: money can be used to make purchases directly, but other assets can’t. But there is a price to be paid for that convenience: money normally yields a lower rate of return than interest-
As an example of how convenience makes it worth incurring some opportunity costs, consider the fact that even today—
Even holding money in a chequing account involves a trade-
So making sense of the demand for money is about understanding how individuals and firms trade off the benefit of holding cash—
Table 15-1 illustrates the opportunity cost of holding money in a specific month, April 2008. The first row shows what interest rate chartered banks offered on 90-day term deposits—
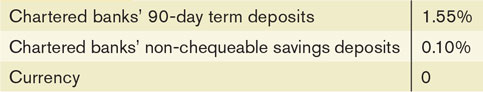
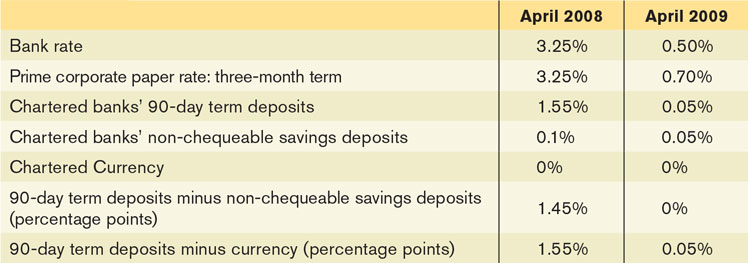
Table 15-1 shows the opportunity cost of holding money at one point in time, but the opportunity cost of holding money changes when the overall level of interest rates changes. Specifically, when the overall level of interest rates falls, the opportunity cost of holding money falls, too.
Short-term interest rates are the interest rates on financial assets that mature within less than a year.
Table 15-2 illustrates this point by showing how selected interest rates changed between April 2008 and April 2009, a period when the Bank of Canada was slashing rates in an effort to fight off the recession triggered by the financial crisis that originated in the United States. A comparison of the two interest rates illustrates what happens when the opportunity cost of holding money falls sharply. Between April 2008 and April 2009, the bank rate, which the BOC can control, fell by 2.75 percentage points. The interest rate on 90-day prime corporate paper fell 2.55 percentage points, while the rate on 90-day term deposits fell by 1.5 percentage points. These interest rates are short-term interest rates—rates on financial assets that come due or mature within less than a year.
As short-
It is no coincidence that the bank rate in Table 15-2 and the interest rates on 90-day term deposits for prime corporate paper fell by similar amounts at the same time. Short-
Between April 2008 and April 2009, the annual percentage rate of growth of currency outside of banks and M1 was 8.5% and 13% respectively. In the year before this, the annual growth rate in these monetary aggregates was only 2.6% and 6.9% respectively. So, obviously the growth rate of these narrow measures of the money supply accelerated significantly in 2008; and, as depicted in Table 15-2, the impact of this increase in the money supply was a significant decrease in short-
Investors will move their wealth into any short-
Long-term interest rates are interest rates on financial assets that mature a number of years in the future.
Table 15-2 contains only short-
The Money Demand Curve
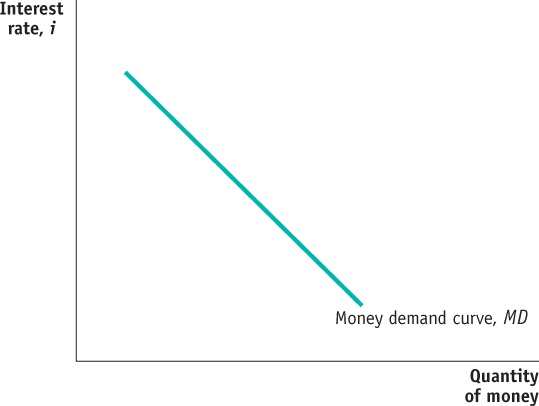
Because the overall level of interest rates affects the opportunity cost of holding money, the quantity of money individuals and firms want to hold is, other things equal, negatively related to the interest rate. In Figure 15-1, the horizontal axis shows the quantity of money demanded and the vertical axis shows the interest rate, i, which you can think of as a representative short-
The money demand curve shows the relationship between the interest rate and the (nominal) quantity of money demanded.
The relationship between the interest rate and the quantity of money demanded by the public is illustrated by the nominal money demand curve, MD, in Figure 15-1. The money demand curve slopes downward because, other things equal, a higher interest rate increases the opportunity cost of holding money, leading the public to reduce the nominal quantity of money it demands. For example, if the interest rate is very low—
By contrast, if the interest rate is relatively high—
You might ask why we draw the money demand curve with the interest rate—
Shifts of the Money Demand Curve
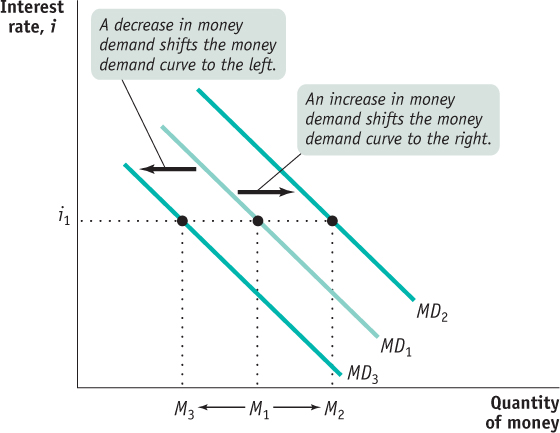
A number of factors other than the interest rate affect the demand for money. When one of these factors changes, the money demand curve shifts. Figure 15-2 shows shifts of the money demand curve: an increase in the demand for money corresponds to a rightward shift of the MD curve, raising the quantity of money demanded at any given interest rate; a decrease in the demand for money corresponds to a leftward shift of the MD curve, reducing the quantity of money demanded at any given interest rate. The most important factors causing the money demand curve to shift are changes in the aggregate price level, changes in real GDP, changes in credit markets and banking technology, and changes in institutions.
Changes in the Aggregate Price Level Canadians keep a lot more cash in their wallets and funds in their chequing accounts today than they did in the 1960s. One reason is that they have to if they want to be able to buy anything: almost everything costs more now than it did when you could get a burger from McDonald’s for about 39 cents and a litre of gasoline for about 7 cents. So, other things equal, higher prices increase the demand for money (a rightward shift of the MD curve), and lower prices decrease the demand for money (a leftward shift of the MD curve).
We can actually be more specific than this: other things equal, the demand for money is proportional to the price level. That is, if the aggregate price level rises by 20%, the quantity of money demanded at any given interest rate, such as i1 in Figure 15-2, also rises by 20%—the movement from M1 to M2. Why? Because if the price of everything rises by 20%, it takes 20% more money to buy the same basket of goods and services. And if the aggregate price level falls by 20%, at any given interest rate the quantity of money demanded falls by 20%—shown by the movement from M1 to M3 at the interest rate i1. As we’ll see later, the fact that money demand is proportional to the price level has important implications for the long-run effects of monetary policy.
Changes in Real GDP Households and firms hold money as a way to facilitate purchases of goods and services. The larger the quantity of goods and services they buy, the larger the quantity of money they will want to hold at any given interest rate. So an increase in real GDP—the total quantity of goods and services produced and sold in the economy—shifts the money demand curve rightward. A fall in real GDP shifts the money demand curve leftward.
Changes in Credit Markets and Banking Technology Credit cards are everywhere in Canadian life today, but it wasn’t always so. Credit cards were introduced in Canada in 1968 with the launch of the Chargex card (this brand name was replaced by Visa in the late 1970s). Master Charge, now known as MasterCard, was introduced in the early 1970s. Before then, people would pay for purchases either with cash or a cheque. The invention of credit cards allowed people to hold less money in order to fund their purchases and decreased the demand for money. In addition, changes in banking technology that made credit cards widely available and widely accepted magnified the effect, making it easier for people to make purchases without having to convert funds from their interest-bearing assets, further reducing the demand for money.
Changes in Institutions At one time, chartered banks were virtually synonymous with the Canadian banking system. Other financial institutions, such as credit unions or trust companies, typically offered higher interest rates on savings accounts than banks did, but had a smaller range of financial services. Following major changes to the Bank Act in 1980, the distinction between these financial institutions has become increasingly blurred. As competition has increased, chartered banks have introduced new types of deposits. For example, the introduction of chequeable savings accounts that pay interest has reduced the opportunity cost of holding funds in chequing accounts, leading to a rise in the demand for money.
The recent combination of increased competition in the banking sector and the increased use of new information technologies that permit online banking is reducing the cost of holding money even further. In particular, chartered banks now offer non-chequeable, high-interest savings accounts that combine the features of a chequing account and a GIC. Such accounts appeal to both banks and depositors. The banks like them because they involve less paperwork than GICs. Depositors like them because they can, via the Internet, easily and instantaneously transfer funds from a high-interest savings account to chequeable accounts, at little or no cost. Again, this development is reducing the opportunity cost of holding money, leading to a rise in the demand for money. As these developments, which make money demand rise, occur, the money demand curve is shifted to the right.
As Figure 15-3 shows, M1, M2, and M3, when expressed as percentages of nominal GDP, have generally increased since 1970. One exception to this increase occurred during the 1970s and early 1980s, when M1 declined as a result of the high, and rising, rate of inflation. This downturn made sense, because M1 consists of narrow money: cash in hand, which pays no interest, and demand deposits at chartered banks, which pay little or no interest. The high inflation in the late 1970s and early 1980s raised nominal interest rates considerably, which in turn increased the opportunity cost of holding M1. As a result, people shifted their financial assets to broad money (M2 and M3), which paid higher rates of interest. Subsequently, as inflation declined during the 1980s and 1990s, the demand for M1 rose back up, toward 20% of GDP. The historically low rates of interest experienced since the financial crisis of 2008–2009 have helped to push the demand for M1 above 20% of GDP. The stronger upward drift to M2 and M3 reflects the impact on money demand that is generated by changes to institutions, rules and regulations, and technology. These innovations have tended to make broad money (M2 or M3) more useful and more valuable to people, which has made them willing to hold (demand) a greater amount of broad money (M2 or M3) as a fraction of GDP.
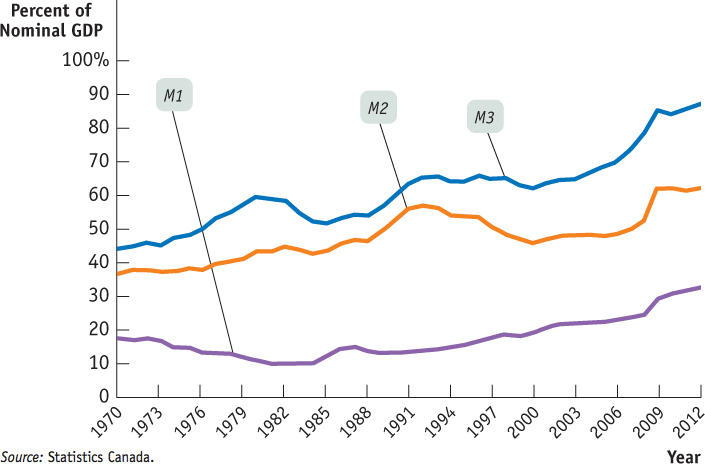
Source: Statistics Canada.
A YEN FOR CASH

Japan, say financial experts, is still a “cash society.” Visitors from Canada or the United States are surprised at how little use the Japanese make of credit cards and how much cash they carry around in their wallets. Yet Japan is an economically and technologically advanced country and, according to some measures, ahead of Canada in the use of telecommunications and information technology. So why do the citizens of this economic powerhouse still do business the way Canadians did a generation ago? The answer highlights the factors affecting the demand for money.
One reason the Japanese use cash so much is that their institutions never made the switch to heavy reliance on plastic. For complex reasons, Japan’s retail sector is still dominated by small mom-and-pop stores, which are reluctant to invest in credit card technology. Japan’s banks have also been slow about pushing transaction technology; visitors are often surprised to find that ATMs close early in the evening rather than staying open all night.
But there’s another reason the Japanese hold so much cash: there’s little opportunity cost to doing so. Short-term interest rates in Japan have been below 1% since the mid-1990s. It also helps that the Japanese crime rate is quite low; you are unlikely to have your wallet full of cash stolen. So why not hold cash?

Quick Review
Money offers a lower rate of return than other financial assets. We usually compare the rate of return on money with short-term, not long-term, interest rates.
Holding money provides liquidity but incurs an opportunity cost that rises with the interest rate, leading to the downward slope of the money demand curve.
Changes in the aggregate price level, real GDP, credit markets and banking technology, and institutions shift the money demand curve. An increase in the demand for money shifts the money demand curve rightward; a decrease in the demand for money shifts the money demand curve leftward.
Check Your Understanding 15-1
CHECK YOUR UNDERSTANDING 15-1
Explain how each of the following would affect the quantity of money demanded. Does the change cause a movement along the money demand curve or a shift of the money demand curve?
Short-term interest rates rise from 5% to 30%.
All prices fall by 10%.
New wireless technology automatically charges supermarket purchases to credit cards, eliminating the need to stop at the cash register.
In order to avoid paying a sharp increase in taxes, residents of Laguria shift their assets into overseas bank accounts. These accounts are harder for tax authorities to trace but also harder for their owners to tap and convert funds into cash.
By increasing the opportunity cost of holding money, a high interest rate reduces the quantity of money demanded. This is a movement up and to the left along the money demand curve.
A 10% fall in prices reduces the quantity of money demanded at any given interest rate, shifting the money demand curve leftward.
This technological change reduces the quantity of money demanded at any given interest rate. So it shifts the money demand curve leftward.
This will increase the demand for money at any given interest rate. With more of the economy’s assets in overseas bank accounts that are difficult to access, people will want to hold more cash to finance purchases.
Which of the following will increase the opportunity cost of holding cash? Reduce it? Have no effect? Explain.
Merchants charge a 1% fee on debit/credit card transactions for purchases of less than $50.
To attract more deposits, banks raise the interest paid on one-year GICs.
It’s the holiday shopping season and retailers have temporarily slashed prices to unexpectedly low levels.
The cost of food rises significantly.
A 1% processing fee on debit/credit card transactions for purchases less than $50 reduces the opportunity cost of holding cash because consumers will save money by paying with cash.
An increase in the interest paid on one-year GICs raises the opportunity cost of holding cash because holding cash requires forgoing the higher interest paid.
When prices fall, the demand for money falls and the money demand curve shifts to the left. In this case, the interest rate would need to fall in order for people to hold the same quantity of money that they did before the prices were slashed.
When prices rise, the demand for money rises and the money demand curve shifts to the right. In this case, the interest rate would need to rise in order for people to hold the same quantity of money that they did before the prices increased; thus the opportunity cost of holding cash rises.