3.9 PROBLEMS
A survey indicated that chocolate is Canadians’ favourite ice-
cream flavour. For each of the following, indicate the possible effects on demand, supply, or both as well as equilibrium price and quantity of chocolate ice cream. A severe drought in Ontario causes dairy farmers to reduce the number of milk-
producing cattle in their herds by a third. These dairy farmers supply cream that is used to manufacture chocolate ice cream. A new report by the Canadian Medical Association reveals that chocolate does, in fact, have significant health benefits.
The discovery of cheaper synthetic vanilla flavouring lowers the price of vanilla ice cream.
New technology for mixing and freezing ice cream lowers manufacturers’ costs of producing chocolate ice cream.
In a supply and demand diagram, draw the shift of the demand curve for hamburgers in your hometown due to the following events. In each case, show the effect on equilibrium price and quantity.
The price of tacos increases.
All hamburger sellers raise the price of their french fries.
Income falls in town. Assume that hamburgers are a normal good for most people.
Income falls in town. Assume that hamburgers are an inferior good for most people.
Hot dog stands cut the price of hot dogs.
The market for many goods changes in predictable ways according to the time of year, in response to events such as holidays, vacation times, seasonal changes in production, and so on. Using the supply and demand model, explain the change in price in each of the following cases. Note that supply and demand may shift simultaneously.
Lobster prices usually fall during the summer peak lobster harvest season, despite the fact that people like to eat lobster during the summer more than at any other time of year.
The price of a Christmas tree is lower after Christmas than before but fewer trees are sold.
The price of a round-
trip ticket to Paris on Air France falls by more than $200 in September, after summer vacation. This happens despite the fact that generally worsening weather increases the cost of operating flights to Paris, and Air France therefore reduces the number of flights to Paris at any given price.
Show in a diagram the effect on the demand curve, the supply curve, the equilibrium price, and the equilibrium quantity of each of the following events.
The market for newspapers in your town
Case 1: The salaries of journalists go up.
Case 2: There is a big news event in your town, which is reported in the newspapers.
The market for Montreal Canadiens cotton T-
shirts Case 1: The Canadiens win the Stanley Cup.
Case 2: The price of cotton increases.
The market for bagels
Case 1: People realize how fattening bagels are.
Case 2: People have less time to make themselves a cooked breakfast.
The market for the Krugman, Wells, Au, and Parkinson economics textbook
Case 1: Your professor makes it required reading for all of his or her students.
Case 2: Printing costs for textbooks are lowered by the use of synthetic paper.
Statistics Canada reported that in 2009 each person in Canada consumed an average of 85 L of soft drinks at an average price of $0.72 per litre. Assume that, at a price of $0.55 per litre, each individual consumer would demand 102 L of soft drinks. The Canadian population in 2009 was 33.7 million. From this information about the individual demand schedule, calculate the market demand schedule for soft drinks for the prices of $0.55 and $0.72 per litre.
Suppose that the supply schedule of Nova Scotia lobsters is as follows:
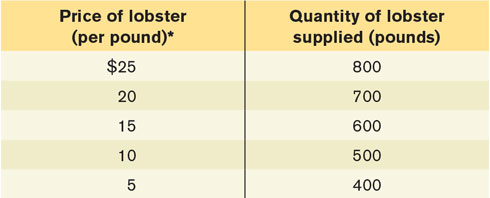 *Commercially, lobsters are priced in dollars per pound.
Suppose that Nova Scotia lobsters can be sold only in Canada. The Canadian demand schedule for Nova Scotia lobsters is as follows:
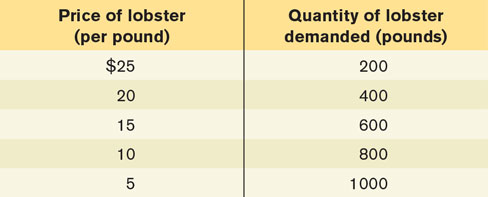
Draw the demand curve and the supply curve for Nova Scotia lobsters. What are the equilibrium price and quantity of lobsters?
Now suppose that Nova Scotia lobsters can be sold in France. The demand schedule for Nova Scotia lobsters in France is as follows:
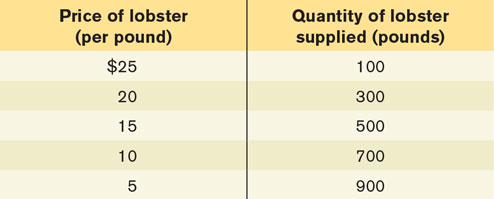
What is the new demand schedule for Nova Scotia lobsters? Draw a supply and demand diagram that illustrates the new equilibrium price and quantity of lobsters. What will happen to the price at which fishers can sell lobster? What will happen to the price paid by Canadian consumers? What will happen to the quantity consumed by Canadian consumers?
Find the flaws in reasoning in the following statements, paying particular attention to the distinction between shifts of and movements along the supply and demand curves. Draw a diagram to illustrate what actually happens in each situation.
“A technological innovation that lowers the cost of producing a good might seem at first to result in a reduction in the price of the good to consumers. But a fall in price will increase demand for the good, and higher demand will send the price up again. It is not certain, therefore, that an innovation will really reduce price in the end.”
“A study shows that eating a clove of garlic a day can help prevent heart disease, causing many consumers to demand more garlic. This increase in demand results in a rise in the price of garlic. Consumers, seeing that the price of garlic has gone up, reduce their demand for garlic. This causes the demand for garlic to decrease and the price of garlic to fall. Therefore, the ultimate effect of the study on the price of garlic is uncertain.”
The following demand schedule is for a normal good.
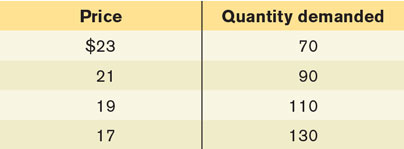
Do you think that the increase in quantity demanded (say, from 90 to 110 in the table) when price decreases (from $21 to $19) is due to a rise in consumers’ income? Explain clearly (and briefly) why or why not.
Would the demand schedule still be valid if it was for an inferior good?
Lastly, assume you do not know whether the good is normal or inferior. Devise an experiment that would allow you to determine which one it was. Explain.
According to the New York Times (November 18, 2006), the number of car producers in China is increasing rapidly. The newspaper reports that “China has more car brands now than the United States. … But while car sales have climbed 38 percent in the first three quarters of this year, automakers have increased their output even faster, causing fierce competition and a slow erosion in prices.” At the same time, Chinese consumers’ incomes have risen. Assume that cars are a normal good. Use a diagram of the supply and demand curves for cars in China to explain what has happened in the Chinese car market.
Aaron Hank is a star hitter for his baseball team. It is widely anticipated that in the next game he will break the major league record for home runs hit during one season. As a result, tickets for the team’s next game have been a hot commodity. But today it is announced that, due to a knee injury, he will not in fact play in the team’s next game. Assume that season ticket-
holders are able to resell their tickets if they wish. Use supply and demand diagrams to explain the following. Show the case in which this announcement results in a lower equilibrium price and a lower equilibrium quantity than before the announcement.
Show the case in which this announcement results in a lower equilibrium price and a higher equilibrium quantity than before the announcement.
What accounts for whether case a or case b occurs?
Suppose that a scalper had secretly learned before the announcement that Aaron Hank would not play in the next game. What actions do you think he would take?
In Rolling Stone magazine, several fans and rock stars, including Pearl Jam, were bemoaning the high price of concert tickets. One superstar argued, “It just isn’t worth $75 to see me play. No one should have to pay that much to go to a concert.” Assume this star sold out arenas around the country at an average ticket price of $75.
How would you evaluate the argument that ticket prices are too high?
Suppose that due to this star’s protests, ticket prices were lowered to $50. In what sense is this price too low? Draw a diagram using supply and demand curves to support your argument.
Suppose Pearl Jam really wanted to bring down ticket prices. Since the band controls the supply of its services, what do you recommend they do? Explain using a supply and demand diagram.
Suppose the band’s next album was a total dud. Do you think they would still have to worry about ticket prices being too high? Why or why not? Draw a supply and demand diagram to support your argument.
Suppose the group announced their next tour was going to be their last. What effect would this likely have on the demand for and price of tickets? Illustrate with a supply and demand diagram.
The accompanying table gives the annual Canadian demand and supply schedules for pickup trucks.
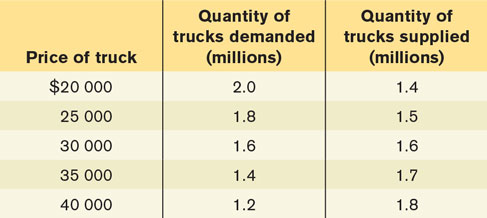
Plot the demand and supply curves using these schedules. Indicate the equilibrium price and quantity on your diagram.
Suppose the tires used on pickup trucks are found to be defective. What would you expect to happen in the market for pickup trucks? Show this on your diagram.
Suppose that Environment Canada imposes costly regulations on manufacturers that cause them to reduce supply by one-
third at any given price. Calculate and plot the new supply schedule. Indicate the new equilibrium price and quantity on your diagram.
After several years of decline, the market for handmade acoustic guitars is making a comeback. These guitars are usually made in small workshops employing relatively few highly skilled luthiers. Assess the impact on the equilibrium price and quantity of handmade acoustic guitars as a result of each of the following events. In your answers indicate which curve(s) shift(s) and in which direction.
Environmentalists succeed in having the use of Brazilian rosewood banned in Canada, forcing luthiers to seek out alternative, more costly woods.
A foreign producer re-
engineers the guitar- making process and floods the market with identical guitars. Music featuring handmade acoustic guitars makes a comeback as audiences tire of heavy metal and alternative rock music.
The country goes into a deep recession and the income of the average Canadian falls sharply.
Demand twisters: Sketch and explain the demand relationship in each of the following statements.
I would never buy a Justin Bieber CD! You couldn’t even give me one for nothing.
I generally buy a bit more coffee as the price falls. But once the price falls to $10 per kilogram, I’ll buy out the entire stock of the supermarket.
I spend more on orange juice even as the price rises. (Does this mean that I’m violating the law of demand?)
Due to a tuition rise, most students at a college find themselves with less disposable income. Almost all of them eat more frequently at the school cafeteria and less often at restaurants, even though prices at the cafeteria have risen, too. (This one requires that you draw both the demand and the supply curves for school cafeteria meals.)
The small town of Middling experiences a sudden doubling of the birth rate. After three years, the birth rate returns to normal. Use a diagram to illustrate the effect of these events on the following.
The market for an hour of babysitting services in Middling today
The market for an hour of babysitting services 14 years into the future, after the birth rate has returned to normal, by which time children born today are old enough to work as babysitters
The market for an hour of babysitting services 30 years into the future, when children born today are likely to be having children of their own
Use a diagram to illustrate how each of the following events affects the equilibrium price and quantity of pizza. Assume that pizza is an inferior good.
The price of mozzarella cheese rises.
A new study reveals hamburgers are unhealthy.
The price of tomato sauce falls.
The incomes of consumers rise.
Consumers expect the price of pizza to fall next week.
Although he was a prolific artist, Pablo Picasso painted only 1000 canvases during his “Blue Period.” Picasso is now dead, and all of his Blue Period works are currently on display in museums and private galleries throughout Europe, Asia, and North America.
Draw a supply curve for Picasso Blue Period works. Why is this supply curve different from ones you have seen?
Given the supply curve from part (a), the price of a Picasso Blue Period work will be entirely dependent on what factor(s)? Draw a diagram showing how the equilibrium price of such a work is determined.
Suppose rich art collectors decide that it is essential to acquire Picasso Blue Period art for their collections. Show the impact of this on the market for these paintings.
Draw the appropriate curve in each of the following cases. Is it like or unlike the curves you have seen so far? Explain.
The demand for cardiac bypass surgery, given that the government pays the full cost for any patient
The demand for elective cosmetic plastic surgery, given that the patient pays the full cost
The supply of reproductions of Rembrandt paintings