5.7 PROBLEMS
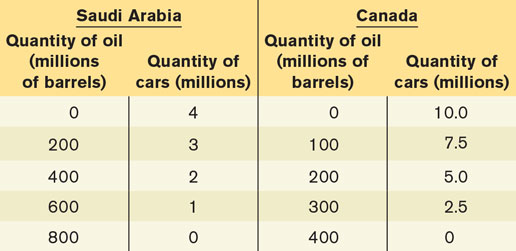
Assume Saudi Arabia and Canada face the production possibilities for oil and cars shown in the accompanying table.

What is the opportunity cost of producing a car in Saudi Arabia? In Canada? What is the opportunity cost of producing a barrel of oil in Saudi Arabia? In Canada?
Which country has the comparative advantage in producing oil? In producing cars?
Suppose that in autarky, Saudi Arabia produces 200 million barrels of oil and 3 million cars; similarly, Canada produces 300 million barrels of oil and 2.5 million cars. Without trade, can Saudi Arabia produce more oil and more cars? Without trade, can Canada produce more oil and more cars?
The production possibilities for Canada and Saudi Arabia are given in Problem 1. Suppose now that each country specializes in the good in which it has the comparative advantage, and the two countries trade. Also assume that for each country the value of imports must equal the value of exports.
What is the total quantity of oil produced? What is the total quantity of cars produced?
Is it possible for Saudi Arabia to consume 400 million barrels of oil and 5 million cars and for Canada to consume 400 million barrels of oil and 5 million cars?
Suppose that, in fact, Saudi Arabia consumes 300 million barrels of oil and 4 million cars and Canada consumes 500 million barrels of oil and 6 million cars. How many barrels of oil does Canada import? How many cars does Canada export? Suppose a car costs $10 000 on the world market. How much, then, does a barrel of oil cost on the world market?
Both Canada and the United States produce lumber and music CDs with constant opportunity costs. The United States can produce either 10 tonnes of lumber and no CDs, or 1000 CDs and no lumber, or any combination in between. Canada can produce either 8 tonnes of lumber and no CDs, or 400 CDs and no lumber, or any combination in between.
Draw the U.S. and Canadian production possibility frontiers in two separate diagrams, with CDs on the horizontal axis and lumber on the vertical axis.
In autarky, if the United States wants to consume 500 CDs, how much lumber can it consume at most? Label this point A in your diagram. Similarly, if Canada wants to consume 1 tonne of lumber, how many CDs can it consume in autarky? Label this point C in your diagram.
Which country has the absolute advantage in lumber production?
Which country has the comparative advantage in lumber production?
Suppose each country specializes in the good in which it has the comparative advantage, and there is trade.
How many CDs does the United States produce? How much lumber does Canada produce?
Is it possible for the United States to consume 500 CDs and 7 tonnes of lumber? Label this point B in your diagram. Is it possible for Canada at the same time to consume 500 CDs and 1 tonne of lumber? Label this point D in your diagram.
For each of the following trade relationships, explain the likely source of the comparative advantage of each of the exporting countries.
Canada exports BlackBerry smart phones to Venezuela, and Venezuela exports oil to Canada.
Canada exports airplanes to China, and China exports clothing to Canada.
Canada exports wheat to Colombia, and Colombia exports coffee to Canada.
Industry Canada provides statistics on Canada’s imports and exports on its website. The following steps will take you to the foreign trade statistics. Use them to answer the questions below.
Go to Industry Canada’s website at www.ic.gc.ca
At the top of the page, under All topics, look for the subheading “Import, export and investment,” and then select “Find import/export statistics”
Once you reach the Trade Data Online page, click on “Search by industry”
In the drop-
down menu “Trade Type,” select “Total Exports” if you are looking for data on exports or “Total Imports” if you are looking for data on imports In the drop-
down menu “Trading Partner,” select “TOP 10 countries” In the drop-
down menu “Time Period,” select “Specific Year(s)” and choose the year(s) you want. Try 2012 and any other year you desire. In the drop-
down menu “Industry Options,” select “Browse List of Industries” In the drop-
down menu “Browse for an industry,” select the good or service you are interested in, or use the North American Industry Classification System (NAICS) code, then hit “View Industries” In the “Industry List,” choose the industry you are interested in and hit “Add to Selected Industries”
Click on “Run Report”
Look up recent data for Canadian imports of clothing accessories and other clothing manufacturing (NAICS code 3159). From which country do we import the most clothing accessories? Which of the three sources of comparative advantage (climate, factor endowments, and technology) accounts for that country’s comparative advantage in clothing accessories?
Look up recent data for Canadian imports of fruits (NAICS code 1113). From which country do we import the most fruit? Which of the three sources of comparative advantage (climate, factor endowments, and technology) accounts for that country’s comparative advantage in fruit?
Look up recent data for Canadian imports of industrial machinery (NAICS code 3332). From which country do we import the most industrial machinery? Which of the three sources of comparative advantage (climate, factor endowments, and technology) accounts for that country’s comparative advantage in industrial machinery?
Compare the data for Canadian imports of clothing accessories from China in 2012 that you found in Problem 5 with the same data for the year 2002.
What happened to the value of Canadian imports of clothing accessories from China in this 10-year period?
What prediction does the Heckscher–
Ohlin model make about the wages received by labour in China?
Shoes are labour-
intensive and satellites are capital- intensive to produce. Canada has abundant capital. China has abundant labour. According to the Heckscher– Ohlin model, which good will China export? Which good will Canada export? In Canada, what will happen to the price of labour (the wage) and to the price of capital?
Before the North American Free Trade Agreement (NAFTA) gradually eliminated import tariffs on goods, the autarky price of tomatoes in Mexico was below the world price and in Canada was above the world price. Similarly, the autarky price of poultry in Mexico was above the world price and in Canada was below the world price. Draw diagrams with domestic supply and demand curves for each country and each of the two goods. As a result of NAFTA, Canada now imports tomatoes from Mexico and Canada now exports poultry to Mexico. How would you expect the following groups to be affected?
Mexican and Canadian consumers of tomatoes. Illustrate the effect on consumer surplus in your diagram.
Mexican and Canadian producers of tomatoes. Illustrate the effect on producer surplus in your diagram.
Mexican and Canadian tomato workers.
Mexican and Canadian consumers of poultry. Illustrate the effect on consumer surplus in your diagram.
Mexican and Canadian producers of poultry. Illustrate the effect on producer surplus in your diagram.
Mexican and Canadian poultry workers.
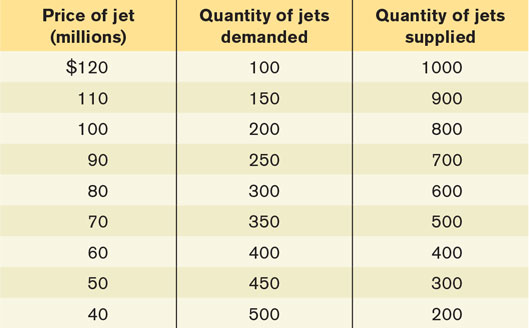
The accompanying table indicates the Canadian domestic demand schedule and domestic supply schedule for commercial jet airplanes. Suppose that the world price of a commercial jet airplane is $100 million.

In autarky, how many commercial jet airplanes does Canada produce, and at what price are they bought and sold?
With trade, what will the price for commercial jet airplanes be? Will Canada import or export airplanes? How many?
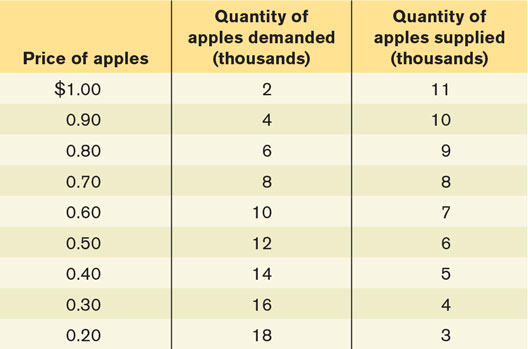
The accompanying table shows the Canadian domestic demand schedule and domestic supply schedule for apples. Suppose that the world price of apples is $0.30 per apple.

Draw the Canadian domestic supply curve and domestic demand curve.
With free trade, how many apples will Canada import or export?
Suppose that the Canadian government imposes a tariff on apples of $0.20 per apple.
How many apples will Canada import or export after introduction of the tariff?
In your diagram, shade the gain or loss to the economy as a whole from the introduction of this tariff.
The Canadian domestic demand schedule and domestic supply schedule for apples was given in Problem 10. Suppose that the world price of apples is $0.30. Canada introduces an import quota of 3000 apples and assigns the quota rents to foreign apple exporters.
Draw the domestic demand and supply curves.
What will the domestic price of apples be after introduction of the quota?
What is the value of the quota rents that foreign exporters of apples receive?
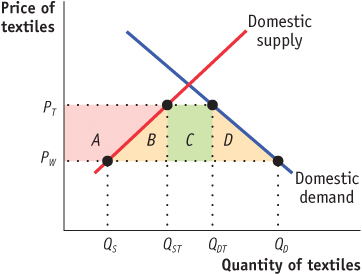
The accompanying diagram illustrates the Canadian domestic demand curve and domestic supply curve for textiles.

The world price of textiles is PW. Canada currently imposes an import tariff on textiles, so the price of textiles is PT. The Canadian government decides to eliminate the tariff. In terms of the areas marked in the diagram, answer the following questions.
What is the gain/loss in consumer surplus?
What is the gain/loss in producer surplus?
What is the gain/loss to the government?
What is the gain/loss to the economy as a whole?
As Canada has opened up to trade, it has lost many of its low-
skill manufacturing jobs, but it has gained jobs in high- skill industries, such as the software industry. Explain whether Canada as a whole has been made better off by trade.
Canada is highly protective of its agricultural industry, imposing import tariffs and import quotas on imports of agricultural goods. This chapter presented three arguments for trade protection. For each argument, discuss whether it is a valid justification for trade protection of Canadian agricultural products.
In World Trade Organization (WTO) negotiations, if a country agrees to reduce trade barriers (tariffs or quotas), it usually refers to this as a concession to other countries. Do you think that this terminology is appropriate?
Producers in import-
competing industries often make the following argument: “Other countries have an advantage in production of certain goods purely because workers abroad are paid lower wages. In fact, Canadian workers are much more productive than foreign workers. So import- competing industries need to be protected.” Is this a valid argument? Explain your answer.
In Canada, producers of milk, poultry, and eggs are protected by government imposed supply management rules. This supply management system is made up of a combination of import controls, production planning quotas, and minimum prices for these products.
Suppose the goal of the government is to design a supply management system for agricultural products that works to support the incomes of farmers. Explain how the use of production quotas and/or price floors would help to achieve this goal. Briefly explain who benefits and who loses under such a system and why this is so.
Why might the supply management system use a combination of a price floor and a production quota?
One important facet of this supply management system are restrictions limiting the import of agricultural products. Explain why such import limits are necessary.
These Canadian import restrictions are generally not welcomed by foreign suppliers (i.e., farmers in the rest of the world). In fact, this is one of the main reasons that talks between Canada and the European Union (EU) on a trade pact were so slow (a free trade agreement in principle was reached in 2013). Explain why the imposition of Canadian import restrictions on many agricultural products is viewed negatively by some of our trading partners.
Suppose European and American farmers are subsidized by their governments in a way that reduces the farmers’ costs. Would the existence of such subsidies strengthen or weaken the need for Canadian import restrictions (to protect the incomes of Canadian farmers)? Explain why or why not.