6.2 The Business Cycle
The Great Depression was by far the worst economic crisis in Canadian history. But although the economy managed to avoid catastrophe for the rest of the twentieth century, it has experienced many ups and downs.
On the positive side, the ups have consistently been bigger than the downs: most chart indicators used to track the Canadian economy show strong upward trends over time. For example, Figure 6-3a shows the levels of real GDP and employment (the number of adults who have paid jobs) between 1961 and 2011. Both real GDP and employment were much higher at the end of the period than at the beginning, and in most years both measures rose.
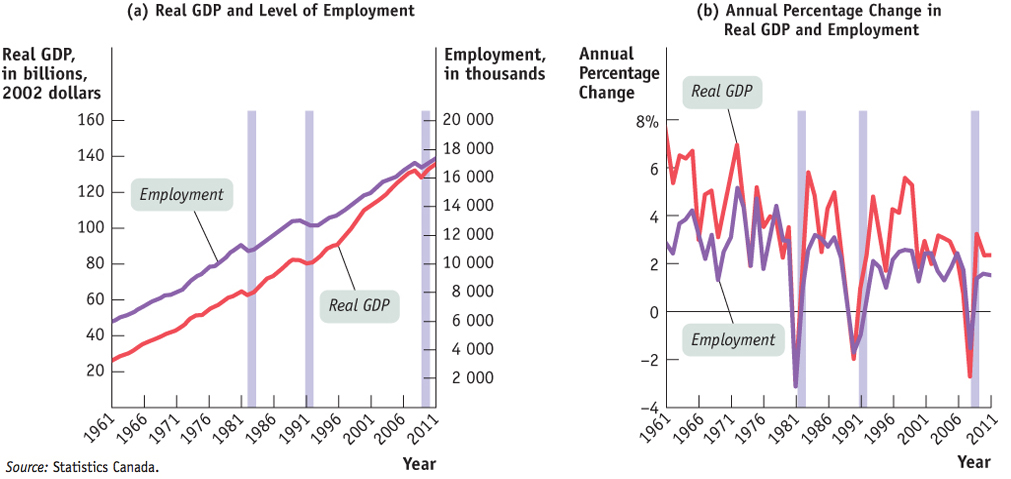
Source: Statistics Canada.
But they didn’t rise steadily. As you can see from the figure, there were three periods—
The economy’s forward march, in other words, isn’t smooth. And the uneven pace of the economy’s progress, its ups and downs, is one of the main preoccupations of macroeconomics.
Charting the Business Cycle
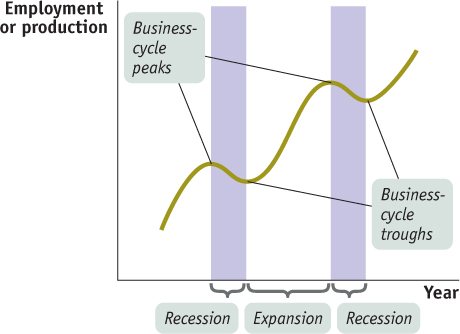
Figure 6-4 shows a stylized representation of the way the economy evolves over time. The vertical axis shows either employment or an indicator of how much the economy is producing, such as industrial production or real gross domestic product (real GDP), which will be discussed in the next chapter. As the data in Figure 6-3 suggest, these two measures tend to move together. Their common movement is the starting point for a major theme of macroeconomics: the economy’s alternation between short-
A broad-
Recessions, or contractions, are periods of economic downturn when output and employment are falling.
Expansions, or recoveries, are periods of economic upturn when output and employment are rising. Many countries use data on a single variable, output, as a proxy for overall economic activity.
The business cycle is the short-
The point at which the economy turns from expansion to recession is a business-cycle peak.
The point at which the economy turns from recession to expansion is a business-cycle trough.
The business cycle is an enduring feature of the economy. As Figure 6-3 shows, the Canadian economy experienced expansions and recessions during the period between 1961 and 2011. Whenever there is a prolonged expansion, as there was in the 1960s and again in the 1990s, books and articles come out proclaiming the end of the business cycle. Such proclamations have always proved wrong: the cycle always comes back. But why does it matter?
The Pain of Recession
Not many people complain about the business cycle when the economy is expanding. Recessions, however, create a great deal of pain.
The most important effect of a recession is its effect on the ability of workers to find and hold jobs. The most widely used indicator of conditions in the labour market is the unemployment rate. We’ll explain how that rate is calculated in Chapter 7, but for now it’s enough to say that a high unemployment rate tells us that jobs are scarce and a low unemployment rate tells us that jobs are easy to find. Figure 6-5 shows the unemployment rate from 1960 to 2011. As you can see, the unemployment rate surged during and after each recession but eventually fell during periods of expansion. For example, it rose sharply in the early 1980s, the early 1990s, and late 2008, during periods of recession.
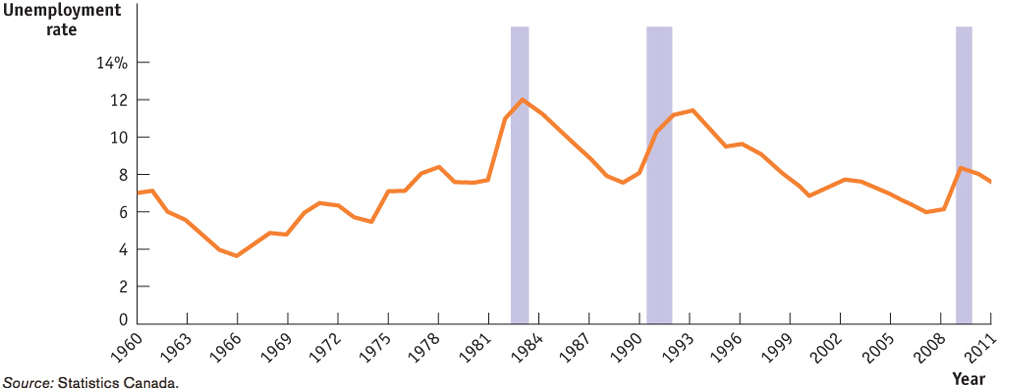
Source: Statistics Canada.
Because recessions cause many people to lose their jobs and also make it hard to find new ones, recessions hurt the standard of living of many families. Recessions are usually associated with a rise in the number of people living below the poverty line, an increase in the number of people unemployed and collecting employment insurance (EI), a rise in bankruptcies, and an increase in the number of homeowners who lose their homes because they can no longer afford their mortgage payments.
You should not think, however, that workers are the only group that suffers during a recession. Recessions are also bad for firms: like employment and wages, profits suffer during recessions, with many small businesses failing, and do well during expansions.
All in all, then, recessions are bad for almost everyone. Can anything be done to reduce their frequency and severity?
DEFINING RECESSIONS AND EXPANSIONS
Some readers may be wondering exactly how recessions and expansions are defined. The answer is that there is no exact definition!
In Canada and many other countries, economists adopt the rule that a recession is a period of at least two consecutive quarters (a quarter is three months) during which the total output of the economy shrinks. The two-
Sometimes, however, this definition seems too strict. For example, an economy that has three months of sharply declining output, then three months of slightly positive growth, then another three months of rapid decline, should surely be considered to have endured a nine-
This panel looks at a variety of economic indicators, with the main focus on employment and production. But, ultimately, the panel makes a judgment call, often with quite a time lag.
Sometimes this judgment is controversial. In fact, there is lingering controversy over the 2001 U.S. recession. According to the NBER, that recession began in March 2001 and ended in November 2001 when output began rising. Some critics argue, however, that the recession really began several months earlier, when industrial production began falling. Other critics argue that the recession didn’t really end in 2001 because employment continued to fall and the job market remained weak for another year and a half.
Taming the Business Cycle
Modern macroeconomics largely came into being as a response to the worst recession in history—
As we explained earlier in this chapter, the work of John Maynard Keynes, published during the Great Depression, suggested that monetary and fiscal policies could be used to mitigate the effects of recessions, and to this day governments turn to Keynesian policies when recession strikes. Later work, notably that of another great macroeconomist, Milton Friedman, led to a consensus that it’s important to rein in booms as well as to fight slumps. So modern policy-
INTERNATIONAL BUSINESS CYCLES
This figure shows the annual rate of growth in industrial production—
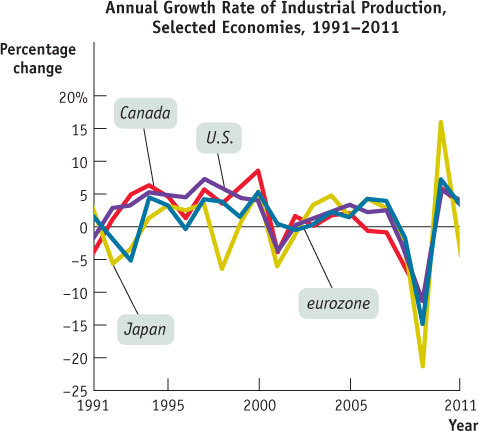
The answer, which is clear from the figure, is yes. Furthermore, business cycles in different economies are often, although not always, synchronized. The downturn of Canadian industrial production of 2001 was paralleled by the recessions in the other three economies; the U.S. Great Recession of 2007–2009 caused a severe slump around the world, including Canada. But not all business cycles are international phenomena. Japan suffered a fairly severe recession in 1998, even as the economies of Canada, the United States, and the eurozone continued to expand.
Sources: OECD, Dataset: Production and Sales (MEI).
Although the business cycle is one of the main concerns of macroeconomics and historically played a crucial role in fostering the development of the field, macroeconomists are also concerned with other issues. We turn next to the question of long-
COMPARING RECESSIONS
The alternation of recessions and expansions seems to be an enduring feature of economic life. However, not all business cycles are created equal. Similarly, the same business cycle may have a quite different impact on distinct economies. Let’s talk about how the “Great Recession” began and how it affected the economies of Canada and the United States.
Source: International Financial Statistics.
The recession began in the U.S. in 2007 and in Canada in late 2008. It was precipitated by a crisis in the U.S. sub-
The shockwaves from the crisis quickly spread to other sectors in the American economy and the rest of the world. It became a full-
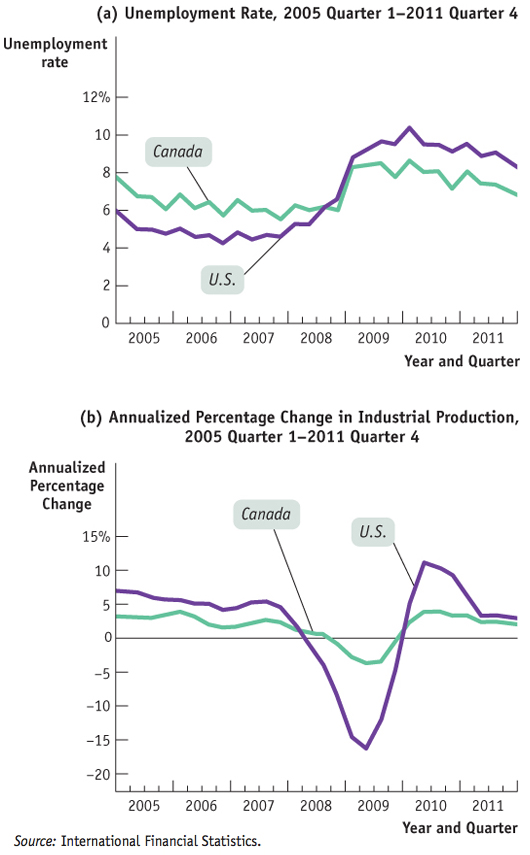
Figure 6-6a shows the unemployment rates for Canada and the U.S. from the first quarter of 2005 to the fourth quarter of 2011. Figure 6-6b shows the annualized rates of change in industrial production for these two countries for the same period. From these graphs, it appears the Canadian and American economies had similar experiences during this time; that is, they moved up and down at roughly the same time. But there are important differences.
Before the 2007–2009 recession, the U.S. had a lower unemployment rate and a higher growth rate in industrial production than Canada did. However, when the crisis hit, the U.S. experienced a much larger increase in its unemployment rate. So, while both countries’ unemployment rates peaked in the first quarter of 2010, the increase in the unemployment rates was quite divergent. For example, Canada’s unemployment rate increased by 3.2 percentage points compared to its lowest level in this seven-
The story for industrial production is similar. Starting in the fourth quarter of 2007, both economies experienced a slowdown in their industrial production, but the growth rate turned negative sooner in the U.S. (in the second quarter of 2008) than in Canada (the fourth quarter of 2008). Moreover, Canada experienced a smaller drop in the growth rate of industrial production and thus in industrial production itself, than the U.S. did.
So the recent financial crisis and the recession it spawned had less impact on Canada than it did on the U.S. Furthermore, Canada was able to recover from the crisis more quickly than the U.S. could.

Quick Review
The business cycle, the short-
run alternation between recessions and expansions, is a major concern of modern macroeconomics. The point at which expansion shifts to recession is a business-cycle peak. The point at which recession shifts to expansion is a business-cycle trough.
Check Your Understanding 6-2
CHECK YOUR UNDERSTANDING 6-2
Why do we talk about business cycles for the economy as a whole, rather than just talking about the ups and downs of particular industries?
We talk about business cycles for the economy as a whole because recessions and expansions are not confined to a few industries—
Describe who gets hurt in a recession, and how.
Recessions cause a great deal of pain across the entire society. They cause large numbers of workers to lose their jobs and make it hard to find new jobs. Recessions hurt the standard of living of many families and are usually associated with a rise in the number of people living below the poverty line, an increase in the number of people who lose their houses because they can’t afford their mortgage payments, and a fall in the percentage of Americans with health insurance. Recessions also hurt the profits of firms.