6.5 International Imbalances
Canada is an open economy: an economy that trades goods and services with other countries. There have been times when our trade was more or less balanced—when Canada sold about as much to the rest of world as it bought. But this isn’t one of those times.
An open economy is an economy that trades goods and services with other countries.
From the late 1990s until 2008, Canada had a trade surplus with other countries. That is, the goods and services it sold to other countries were worth more than the goods and services it bought from them. But, starting in 2009, Canada ran a trade deficit, so that the goods and services Canada sold were worth less than the goods and services it bought. The United States was in a similar position, with an even larger deficit than Canada’s. Meanwhile, some other countries were in the exact opposite position, going into a trade surplus. Figure 6-9 shows the exports and imports of goods for four important economies in 2011: Canada, the United States, Germany, and China. As you can see, Canada and the United States imported more than they exported, while Germany and China did the reverse: they ran a trade surplus. Was Canada’s trade deficit a sign that something was wrong with our economy—that we couldn’t make things that other countries wanted to buy?
A country runs a trade surplus when the value of goods and services bought from other countries is less than the value of the goods and services it sells to them. It runs a trade deficit when the value of goods and services bought from other countries is more than the value of goods and services it sells to them.
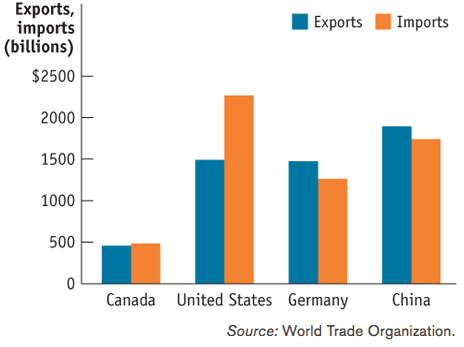
Source: World Trade Organization.
No, not really. Trade deficits and their opposite, trade surpluses, are macroeconomic phenomena. They’re the result of situations in which the whole is very different from the sum of its parts. You might think that countries with highly productive workers or widely desired products and services to sell run trade surpluses while countries with unproductive workers or poor-quality products and services run deficits. But the reality is that there’s no simple relationship between the success of an economy and whether it runs trade surpluses or deficits.
Microeconomic analysis tells us why countries trade but not why they run trade surpluses or deficits. In Chapter 2 we learned that international trade is the result of comparative advantage: countries export goods they’re relatively good at producing and import goods they’re not as good at producing. That’s why Canada exports wheat and imports pineapples. One important thing the concept of comparative advantage doesn’t explain, however, is why the value of a country’s imports is sometimes much larger than the value of its exports, or vice versa.
So what does determine whether a country runs a trade surplus or a trade deficit? In Chapter 19 we’ll learn the surprising answer: the determinants of the overall balance between exports and imports lie in decisions about savings and investment spending—spending on goods like machinery and factories that are in turn used to produce goods and services for consumers. Countries with high investment spending relative to savings run trade deficits; countries with low investment spending relative to savings run trade surpluses.
BALTIC BALANCING ACT
The Soviet Union, once the second-largest world power, broke up into 15 independent countries in 1991. Many of these countries have had a hard time finding a new place in the world, both politically and economically. However, the three small nations of Estonia, Latvia, and Lithuania—often referred to as the “Baltics” because they all have coastlines on the Baltic Sea—were quick both to establish democratic institutions and to move to market economies, building strong ties to the democratic market economies of Western Europe.
What has this meant for their international trade? Figure 6-10 shows the current account balances of the three countries—a broad definition of their trade balances—from 2000 to 2010. As you can see, in the middle years of that decade, all three countries began running sizable deficits (amounting in each case to more than 10% of the total value of goods and services they produced). Then, after 2008, all three suddenly moved into surplus.
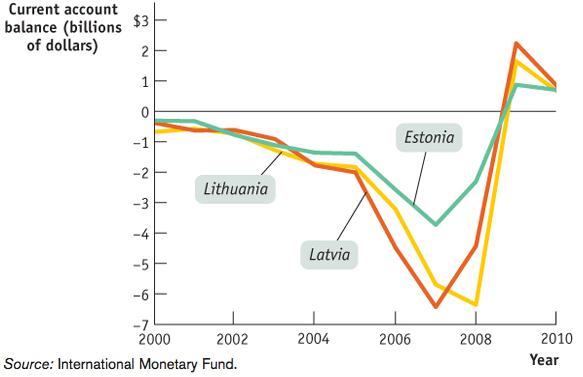
Source: International Monetary Fund.
Does this mean that these economies were doing badly around 2005 or 2006 and that they rapidly improved late in the decade? Actually, it was the opposite. During the period from 2000 to 2007, financial markets were extremely optimistic about the economic prospects of the Baltic nations and poured money into the countries, allowing them to engage in high rates of investment spending and, correspondingly, to run large trade deficits. When the world plunged into financial crisis, this inflow of funds dried up, forcing the Baltics to move into trade surplus. The adjustment was hard on the three countries, all of which saw unemployment rates rise to Depression-era levels.

Quick Review
Comparative advantage can explain why an open economy exports some goods and services and imports others, but it can’t explain why a country imports more than it exports, or vice versa.
Trade deficits and trade surpluses are macroeconomic phenomena, determined by decisions about investment spending and savings.
Check Your Understanding 6-5
CHECK YOUR UNDERSTANDING 6-5
Which of the following reflect comparative advantage, and which reflect macroeconomic forces?
Thanks to the development of huge oil sands in Alberta, Canada has become an exporter of oil and an importer of manufactured goods.
Like many consumer goods, the Apple iPod is assembled in China, although many of the components are made in other countries.
Since 2002, Germany has been running huge trade surpluses, exporting much more than it imports.
Canada, which had a trade surplus beginning in the late 1990s, started running trade deficits in 2009, as the 2008 financial crisis took hold.
This situation reflects comparative advantage. Canada’s comparative advantage results from the development of oil—Canada now has an abundance of oil.
This situation reflects comparative advantage. China’s comparative advantage results from an abundance of labour; China is good at labour-intensive activities such as assembly.
This situation reflects macroeconomic forces. Germany has been running a huge trade surplus because of underlying decisions regarding savings and investment spending with its savings in excess of its investment spending.
This situation reflects macroeconomic forces. Canada’s trade balance changed from a surplus to a deficit in 2009 because the 2008 financial crisis had reduced the foreign demand for Canadian goods, which lowered Canada’s exports. Alternatively, the 2008 financial crisis lowered national output in Canada, which also reduced savings. Holding all else constant, the reduction in savings makes investment spending outstrip Canada’s savings.
General Motors–The Demotion of A General

On June 1, 2009, General Motors (GM) filed for bankruptcy. It was a sad comedown for a company that had once been the leading symbol of North American automobile success. General Motors Canada had just finished celebrating its 100th anniversary in the auto business a year earlier.
The 2009 bankruptcy didn’t mean that GM shut down; the company was able to continue operating, thanks to the more than $60 billion in aid that it received from the governments of Canada, Ontario, and the United States. In return for that aid, these governments received stock in the restructured company. The government’s intention was to avoid the economic catastrophe that liquidation might cause, preserve some jobs, and sell off that stock once the company was profitable again.
But why did government officials believe GM had a reasonable prospect of returning to profitability? Their case was based on an observation and a prediction.
The observation was that GM’s troubles weren’t unique. To be sure, the company had been badly run and needed both to make better cars and to reduce its costs. But all North American automakers were in trouble: overall car sales had slumped and, beyond that, overall manufacturing production had slumped. The association of weak auto sales with a general manufacturing slump fit the historical pattern. Figure 6-11 shows Canadian auto sales and total Canadian manufacturing production as a percentage of capacity; the two series have often, although not always, moved together.
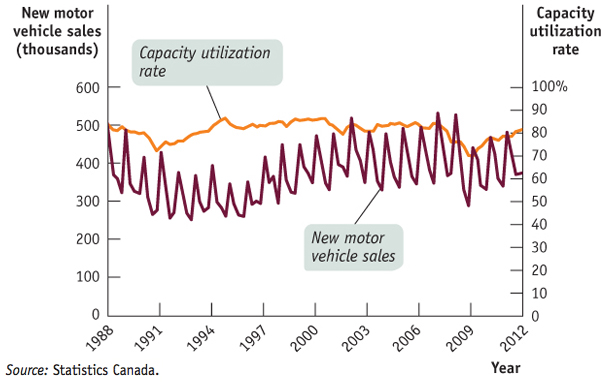
Source: Statistics Canada.
The prediction was that both manufacturing production and auto sales would soon rebound, improving GM’s bottom line. And this indeed proved to be the case: as the economy bounced back, so did General Motors, which returned to profitability in 2010. By late 2010, the governments were able to start selling off their stock, and expectations were that taxpayers would eventually get most of their money back.
In this case, the governments were able to save a company and preserve some jobs in the auto sector. In fact, in return for their aid to GM Canada, the Canadian and Ontario governments were assured that GM would maintain at least a certain percentage of their annual North American production in Canada.
QUESTIONS FOR THOUGHT
Why do overall manufacturing production and auto sales often move together?
Why do overall manufacturing production and auto sales often move together?
Why was it reasonable to predict in June 2009 that auto sales would improve in the near future?
Why was it reasonable to predict in June 2009 that auto sales would improve in the near future?
Why were the governments especially lucky that they stepped in to rescue GM in June 2009 rather than, say, six months earlier?
Why were the governments especially lucky that they stepped in to rescue GM in June 2009 rather than, say, six months earlier?