7.6 PROBLEMS
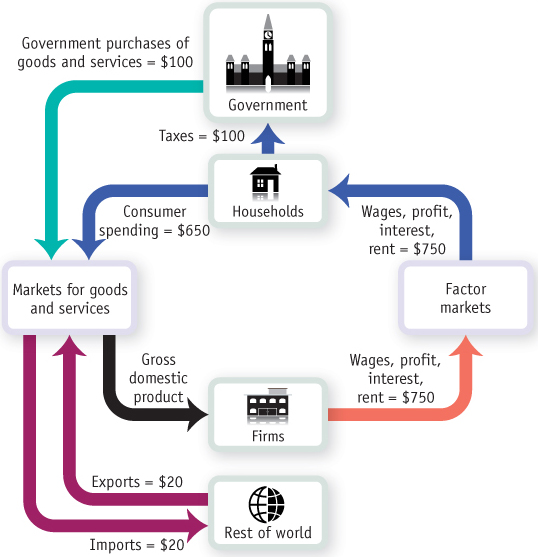
At right is a simplified circular-
flow diagram for the economy of Micronia. (Note that there is no investment in Micronia.) What is the value of GDP in Micronia?
What is the value of net exports?
What is the value of disposable income?
Does the total flow of money out of households—
the sum of taxes paid and consumer spending— equal the total flow of money into households? How does the government of Micronia finance its purchases of goods and services?
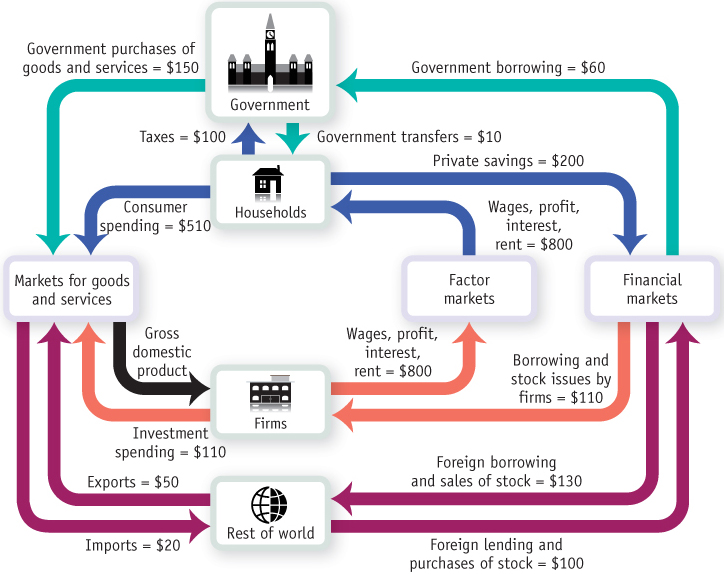
A more complex circular-
flow diagram for the economy of Macronia is shown at right. (Note that Macronia has investment and financial markets.) What is the value of GDP in Macronia?
What is the value of net exports?
What is the value of disposable income?
Does the total flow of money out of households—
the sum of taxes paid, consumer spending, and private savings— equal the total flow of money into households? How does the government finance its spending?
Consider the following table for Canada’s GDP in 2011.
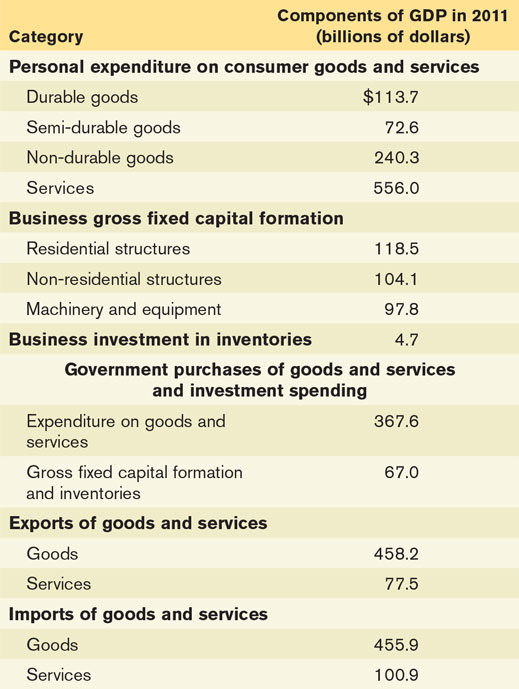
Calculate 2011 consumer spending.
Calculate 2011 private investment spending.
Calculate 2011 net exports.
Calculate 2011 government purchases of goods and services and investment spending.
Calculate 2011 gross domestic product.
Calculate consumer spending on services as a percentage of total consumer spending.
Calculate 2011 exports as a percentage of imports.
Calculate 2011 exports and imports as a percentage of gross domestic product. Was there a trade surplus or trade deficit in 2011? How large was this as a percentage of GDP?
The small economy of Pizzania produces three goods (bread, cheese, and pizza), each produced by a separate company. The bread and cheese companies produce all the inputs they need to make bread and cheese, respect-
ively. The pizza company uses the bread and cheese from the other companies to make its pizzas. All three companies employ labour to help produce their goods, and the difference between the value of goods sold and the sum of labour and input costs is the firm’s profit. The accompanying table summarizes the activities of the three companies when all the bread and cheese produced are sold to the pizza company as inputs in the production of pizzas. 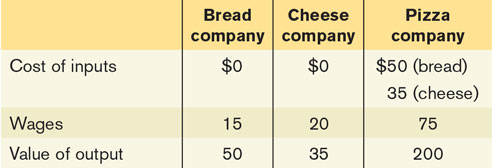
Calculate GDP as the value added in production.
Calculate GDP as spending on final goods and services.
Calculate GDP as income earned from production.
In the economy of Pizzania (from Problem 4), bread and cheese produced are sold both to the pizza company for inputs in the production of pizzas and to consumers as final goods. The accompanying table summarizes the activities of the three companies.
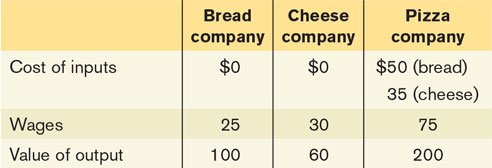
Calculate GDP as the value added in production.
Calculate GDP as spending on final goods and services.
Calculate GDP as income earned from production.
Which of these transactions should be included in Canada’s GDP?
Canada Dry builds a new bottling plant in Canada.
Air Canada sells one of its existing airplanes to Korean Air.
Ms. Moneybags buys an existing share of Telus Corporation.
A softwood lumber firm in British Columbia sells softwood lumber to a construction firm in California.
A Canadian buys a bottle of French perfume in Paris.
A Canadian book publisher produces too many copies of a new book. The books don’t sell this year, so the publisher adds the surplus books to inventories.
The economy of Britannica produces three goods: computers, DVDs, and pizza. The accompanying table shows the prices and output of the three goods for the years 2010, 2011, and 2012.
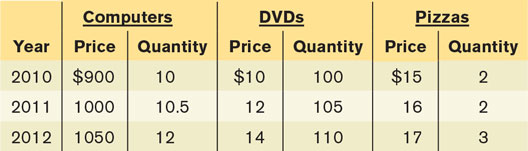
What is the percent change in production of each of the goods from 2010 to 2011 and from 2011 to 2012?
What is the percent change in prices of each of the goods from 2010 to 2011 and from 2011 to 2012?
Calculate nominal GDP in Britannica for each of the three years. What is the percent change in nominal GDP from 2010 to 2011 and from 2011 to 2012?
Calculate real GDP in Britannica using 2010 prices for each of the three years. What is the percent change in real GDP from 2010 to 2011 and from 2011 to 2012?
The accompanying table shows data on nominal GDP (in billions of 2002 dollars) and population (in thousands) of Canada in 1960, 1970, 1980, 1990, 2000, and 2010. The Canadian price level rose consistently from 1960 to 2010
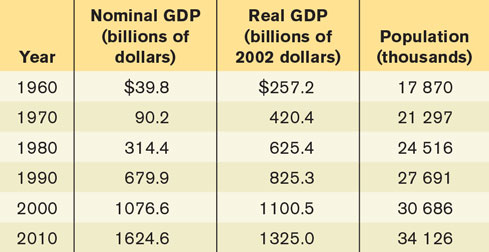
Why is real GDP greater than nominal GDP for all years until 2000 and lower for 2010?
Calculate the percent change in real GDP from 1960 to 1970, 1970 to 1980, 1980 to 1990, 1990 to 2000, and 2000 to 2010. Which period had the highest growth rate?
Calculate real GDP per capita for each of the years in the table.
Calculate the percent change in real GDP per capita from 1960 to 1970, 1970 to 1980, 1980 to 1990, 1990 to 2000, and 2000 to 2010. Which period had the highest growth rate?
How do the percent change in real GDP and the percent change in real GDP per capita compare? Which is larger? Do we expect them to have this relationship?
Kwantlen Polytechnic University is concerned about the rising price of textbooks that students must purchase. To better identify the increase in the price of textbooks, the dean asks you, the Economics Department’s star student, to create an index of textbook prices. The average student purchases three English, two math, and four economics textbooks per year. The prices of these books are given in the accompanying table.
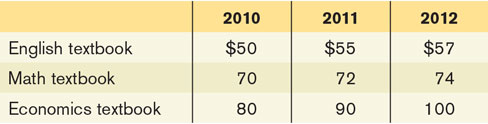
What is the percent change in the price of an English textbook from 2010 to 2012?
What is the percent change in the price of a math textbook from 2010 to 2012?
What is the percent change in the price of an economics textbook from 2010 to 2012?
Using 2010 as a base year, create a price index for these books for all years.
What is the percent change in the price index from 2010 to 2012?
The consumer price index, or CPI, measures the cost of living for a typical household by multiplying the price for each category of expenditure (housing, food, and so on) by a measure of the importance of that expenditure in the average consumer’s market basket and summing over all categories. However, using data from the consumer price index, we can see that changes in the cost of living for different types of consumers can vary a great deal. Let’s compare the cost of living for a hypothetical retired person and a hypothetical university student. Let’s assume that the market basket of a retired person is allocated in the following way: 10% on housing, 15% on food, 5% on transportation, 60% on medical care, 0% on education, and 10% on recreation. The university student’s market basket is allocated as follows: 5% on housing, 15% on food, 20% on transportation, 0% on medical care, 40% on education, and 20% on recreation. The accompanying table shows the April 2012 CPI for each of the relevant categories.
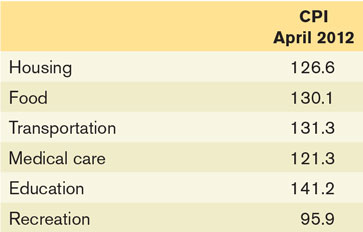
Calculate the overall CPI for the retired person and for the university student by multiplying the CPI for each of the categories by the relative importance of that category to the individual and then summing each of the categories. The CPI for all items in April 2012 was 122.2. How do your calculations for a CPI for the retired person and the university student compare to the overall CPI?
Each month Statistics Canada releases the Consumer Price Index estimates for the previous month. Go to StatCan’s home page at www.statcan.gc.ca. Pick English or French. Click on the “CPI annual inflation” link under the “Latest Indicators” heading. This will open the latest CPI update in StatCan’s “Daily.” Go to the bottom of the page and click Table 1 for the “not seasonally adjusted figures.” What was the CPI for the previous month, that is, the month before this one? How did it change from one month to the next? How does the CPI compare to the same month last year?
The accompanying table provides the annual real GDP (in billions of 2002 dollars) and nominal GDP (in billions of dollars) for Canada.
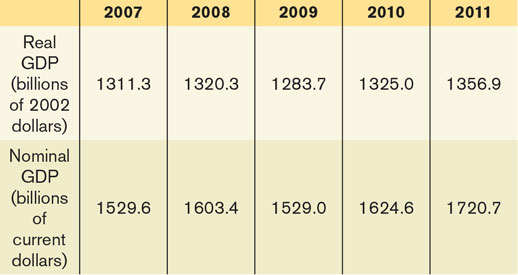
Calculate the GDP deflator for each year.
Use the GDP deflator to calculate the inflation rate for all years except 2007.
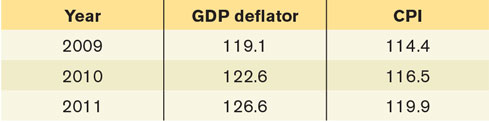
The accompanying table contains two price indexes for the years 2009, 2010, and 2011: the GDP deflator and the CPI. For each price index, calculate the estimated inflation rate from 2009 to 2010 and from 2010 to 2011. (Note that both price indexes have a 2002 base year.)
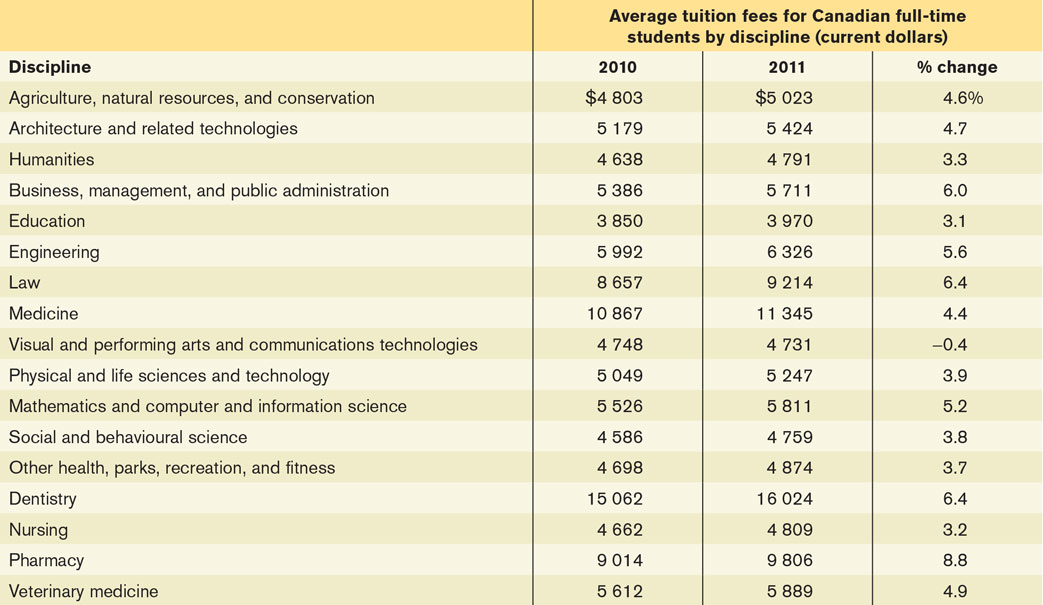
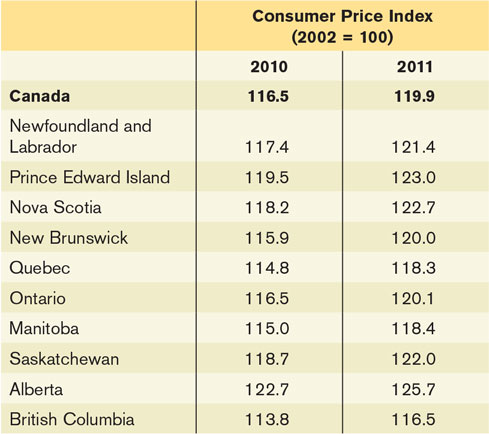
The cost of undergraduate (university) education in Canada has risen in recent years. These tables show the average cost of tuition for Canadian full-
time students for the academic years that began in 2010 and 2011, measured in current dollars, and the consumer price index (CPI) in 2010 and 2011. 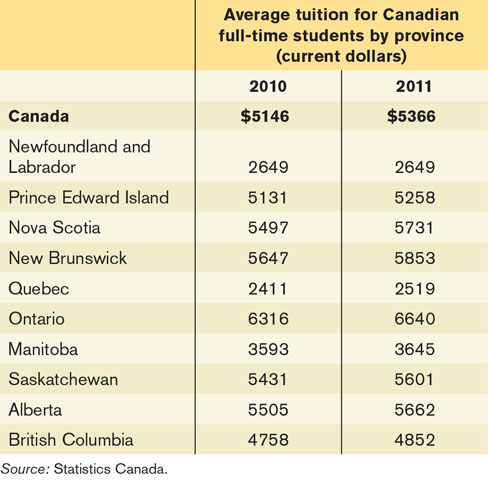
Calculate the percentage change in average tuition from 2010 to 2011 in Canada and in each province.
Calculate the percentage change in the CPI from 2010 to 2011 in Canada and in each province.
Did an average Canadian undergraduate student find that his or her tuition fees increased faster than the overall cost of living? Does your answer depend on which province the student lived in?
Consider this table, which gives the average annual tuition according to discipline. Which disciplines had an increase in tuition that is above the national average increase?