9.8 PROBLEMS
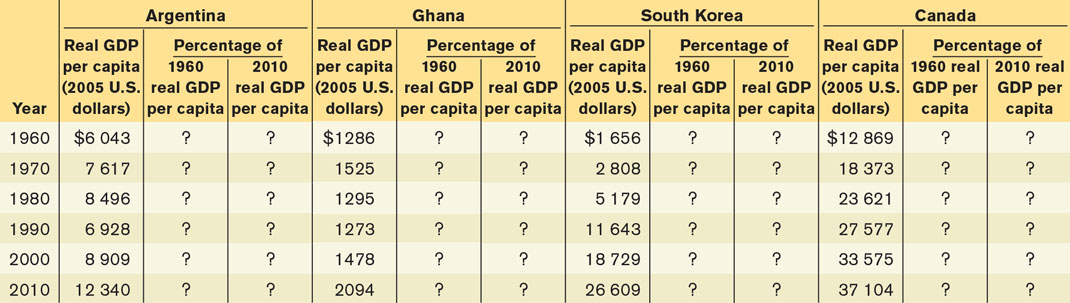
The accompanying table shows data from the World Bank for real GDP per capita (in 2005 U.S. dollars) for Argentina, Ghana, South Korea, and Canada for 1960, 1970, 1980, 1990, 2000, and 2010.
Fill in the empty table cells by expressing each year’s real GDP per capita as a percentage of its 1960 and 2010 levels.
How does the growth in living standards from 1960 to 2010 compare across these four nations? What might account for these differences?
The accompanying table shows the average annual growth rate in real GDP per capita for the past few decades for Argentina, Ghana, and South Korea using data from the Penn World Table, Version 7.1.
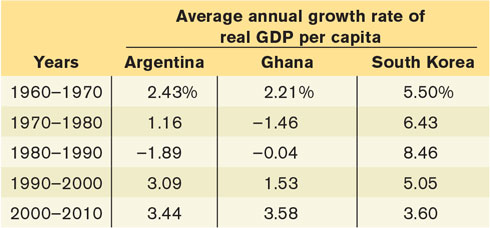
For each decade and for each country, use the Rule of 70 where possible to calculate how long it would take for that country’s real GDP per capita to double.
Suppose that the average annual growth rate that each country achieved over the period 2000–2010 continues indefinitely into the future. Starting from 2000, use the Rule of 70 to calculate, where possible, the year in which a country will have doubled its real GDP per capita.
The accompanying table provides approximate statistics on per capita income levels and growth rates for regions defined by income levels. According to the Rule of 70, starting in 2010 the high-
income countries are projected to double their per capita GDP in approximately 78 years, in 2088. Throughout this question, assume constant growth rates for each of the regions that are equal to their average value between 2000 and 2010. 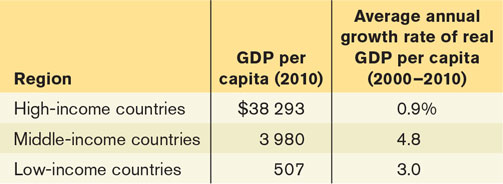
Calculate the ratio of per capita GDP in 2010 of the following:
Middle-
income to high- income countries Low-
income to high- income countries Low-
income to middle- income countries
Calculate the number of years it will take the low-
income and middle- income countries to double their per capita GDP. Calculate the per capita GDP of each of the regions in 2088. (Hint: How many times does their per capita GDP double in 78 years, the number of years from 2010 to 2088?)
Repeat part (a) with the projected per capita GDP in 2088.
Compare your answers to parts (a) and (d). Comment on the change in economic inequality between the regions.
You are hired as an economic consultant to the countries of Albernia and Brittania. Each country’s current relationship between physical capital per worker and output per worker is given by the curve labelled “Productivity1” in the accompanying diagram. Albernia is at point A and Brittania is at point B.
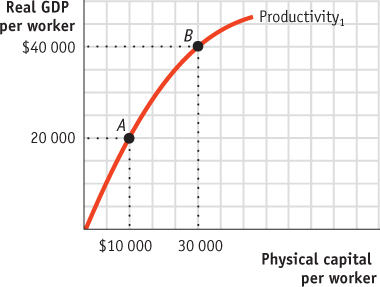
In the relationship depicted by the curve Productivity1, what factors are held fixed? Do these countries experience diminishing returns to physical capital per worker?
Assuming that the amount of human capital per worker and the technology are held fixed in each country, can you recommend a policy to generate a doubling of real GDP per capita in Albernia?
How would your policy recommendation change if the amount of human capital per worker could be changed? Assume that an increase in human capital doubles the output per worker when physical capital per worker equals $10 000. Draw a curve on the diagram that represents this policy for Albernia.
The country of Androde is currently using Method 1 for its production function. By chance, scientists stumble onto a technological breakthrough that will enhance Androde’s productivity. This technological breakthrough is reflected in another production function, Method 2. The accompanying table shows combinations of physical capital per worker and output per worker for both methods, assuming that human capital per worker is fixed.
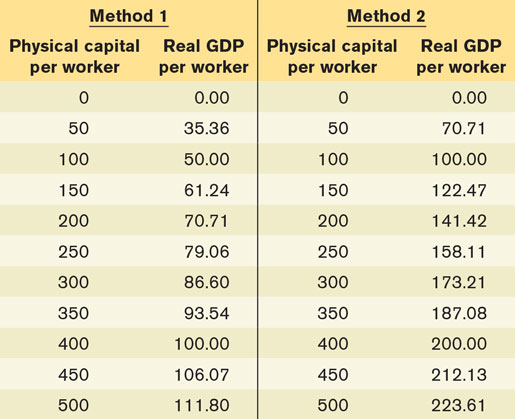
Using the data in the accompanying table, draw the two production functions in one diagram. Androde’s current amount of physical capital per worker is 100. In your figure, label that point A.
Starting from point A, over a period of 70 years, the amount of physical capital per worker in Androde rises to 400. Assuming Androde still uses Method 1, in your diagram, label the resulting point of production B. Using the Rule of 70, calculate by how many percent per year output per worker has grown.
Now assume that, starting from point A, over the same period of 70 years, the amount of physical capital per worker in Androde rises to 400, but that during that time period, Androde switches to Method 2. In your diagram, label the resulting point of production C. Using the Rule of 70, calculate by how many percent per year output per worker has grown now.
As the economy of Androde moves from point A to point C, what share of the annual productivity growth is due to higher total factor productivity?
Statistics Canada regularly releases data on the country’s labour productivity and labour cost. Go to StatCan’s home page at www.statcan.gc.ca. Pick English or French. Go to the middle section of the home page and click on “Economic accounts” under “Browse by subject.” Then click “Productivity accounts” under “Subtopics.” Click “Detailed tables from CANSIM” under “Resources,” and choose Table 383-0012 (Indexes of labour productivity and related variables, by North American Industry Classification System (NAICS), seasonally adjusted). You should find data on labour productivity for different sectors. What were the percent changes in labour productivity in the goods sector, the services sector, and the non-
business sector for the previous quarter? How does the percent change in that quarter’s productivity compare to data from the previous quarter?
What roles do physical capital, human capital, technology, and natural resources play in influencing long-
run economic growth of aggregate output per capita?
How have policies and institutions in Canada influenced the country’s long-
run economic growth?
Over the next 100 years, real GDP per capita in Groland is expected to grow at an average annual rate of 2.0%. In Sloland, however, growth is expected to be somewhat slower, at an average annual growth rate of 1.5%. If both countries have a real GDP per capita today of $20 000, how will their real GDP per capita differ in 100 years? [Hint: A country that has a real GDP today of $x and grows at y% per year will achieve a real GDP of $x × (1 + (y/100))z in z years. We assume that 0 ≤ y < 10.]
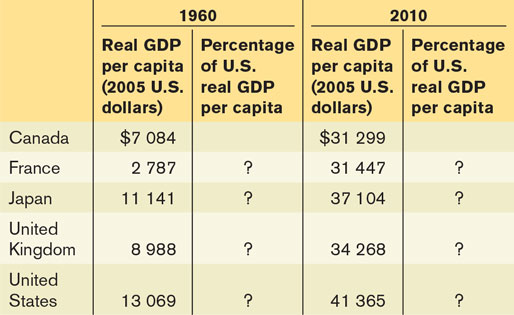
The accompanying table shows data from the Penn World Table, Version 7.1 for real GDP per capita (in 2005 U.S. dollars) for Canada, France, Japan, the United Kingdom, and the United States in 1960 and 2010. Complete the table. Have these countries converged economically?
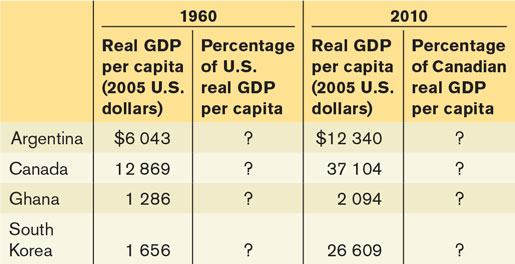
The accompanying table shows data from the Penn World Table, Version 7.1 for real GDP per capita (in 2005 U.S. dollars) for Argentina, Canada, Ghana, and South Korea om 1960 and 2010. Complete the table by filling in all empty cells. Have the economies of these countries converged?
According to the Oil & Gas Journal, the proven oil reserves existing in the world in 2009 consisted of 1342 billion barrels. In that year, the U.S. Energy Information Administration reported that the world daily oil production was 72.26 million barrels a day.
At this rate, for how many years will the proven oil reserves last? Discuss the Malthusian view in the context of the number you just calculated.
In order to do the calculations in part (a), what did you assume about the total quantity of oil reserves over time? About oil prices over time? Are these assumptions consistent with the Malthusian view on resource limits?
Discuss how market forces may affect the amount of time the proven oil reserves will last, assuming that no new oil reserves are discovered and that the demand curve for oil remains unchanged.
The accompanying table shows the annual growth rate for the years 2000–2009 in per capita emissions of carbon dioxide (CO2) and the annual growth rate in real GDP per capita for selected countries.
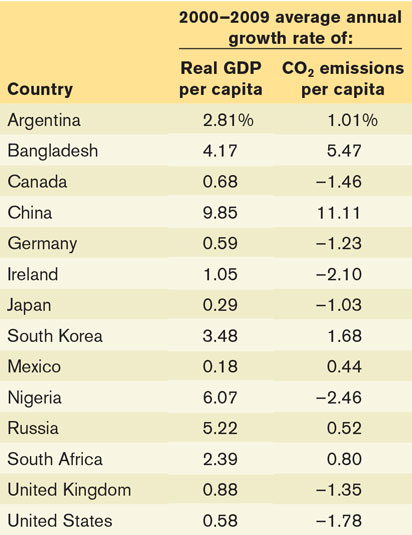
Rank the countries in terms of their growth in CO2 emissions, from highest to lowest. What five countries have the highest growth rate in emissions? What five countries have the lowest growth rate in emissions?
Now rank the countries in terms of their growth in real GDP per capita, from highest to lowest. What five countries have the highest growth rate? What five countries have the lowest growth rate?
Would you infer from your results that CO2 emissions are linked to growth in output per capita?
Do high growth rates necessarily lead to high CO2 emissions?