22-3
U.S. GDP in 2013: Two Methods of Calculating GDP
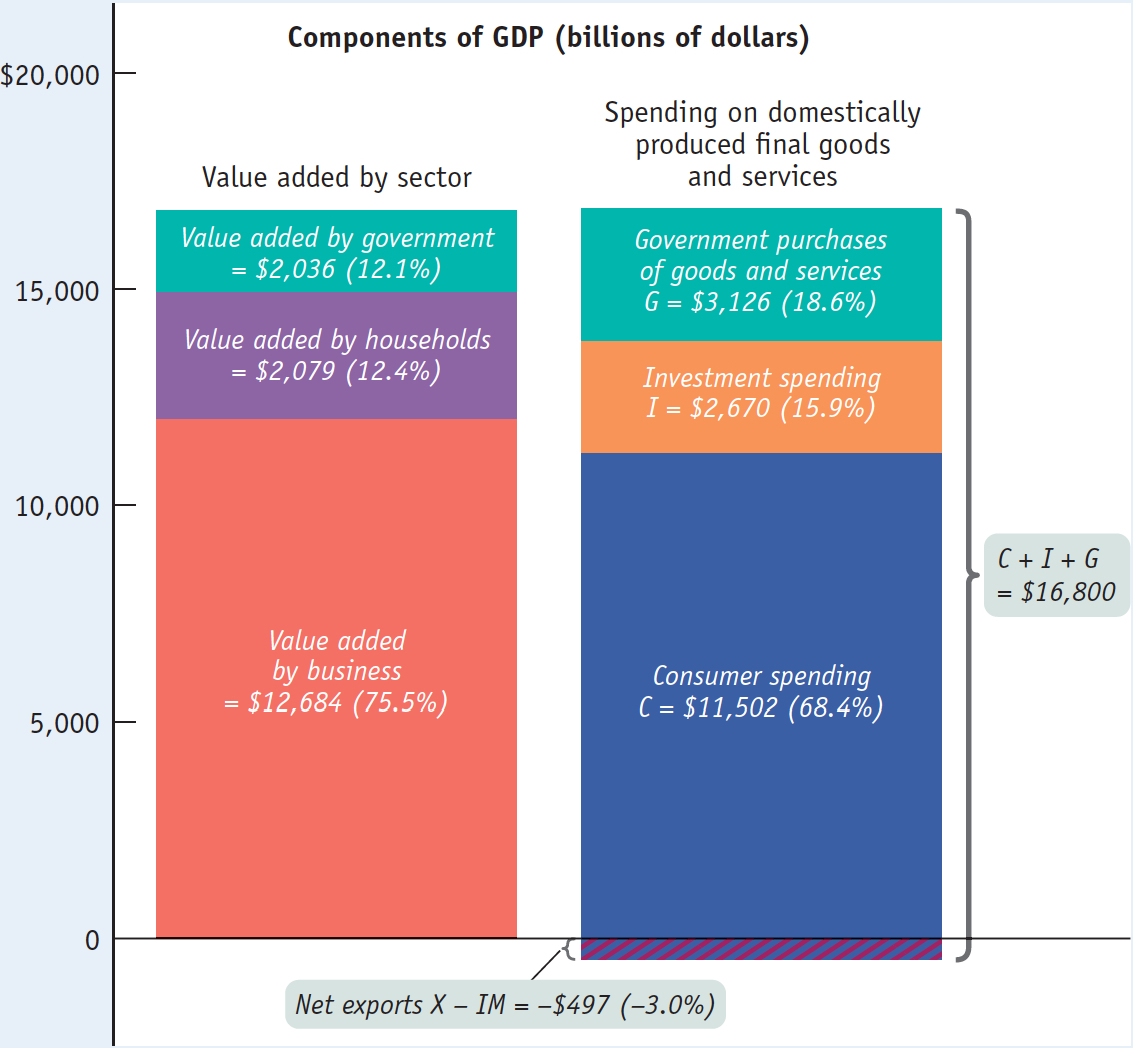
U.S. GDP in 2013: Two Methods of Calculating GDP The two bars show two equivalent ways of calculating GDP. The height of each bar above the horizontal axis represents $16,800 billion, U.S. GDP in 2013. The left bar shows the breakdown of GDP according to the value added of each sector of the economy: government, households, and firms. The right bar shows the breakdown of GDP according to the four types of aggregate spending: C + I + G + X − IM. The right bar has a total length of $16,800 billion + $497 billion = $17,297 billion. The $497 billion, shown as the area extending below the horizontal axis, is the amount of total spending absorbed by net exports, which were negative in 2013. (Numbers don’t add due to rounding.) Source: Bureau of Economic Analysis.