27-4
Shifts of the Aggregate Demand Curve
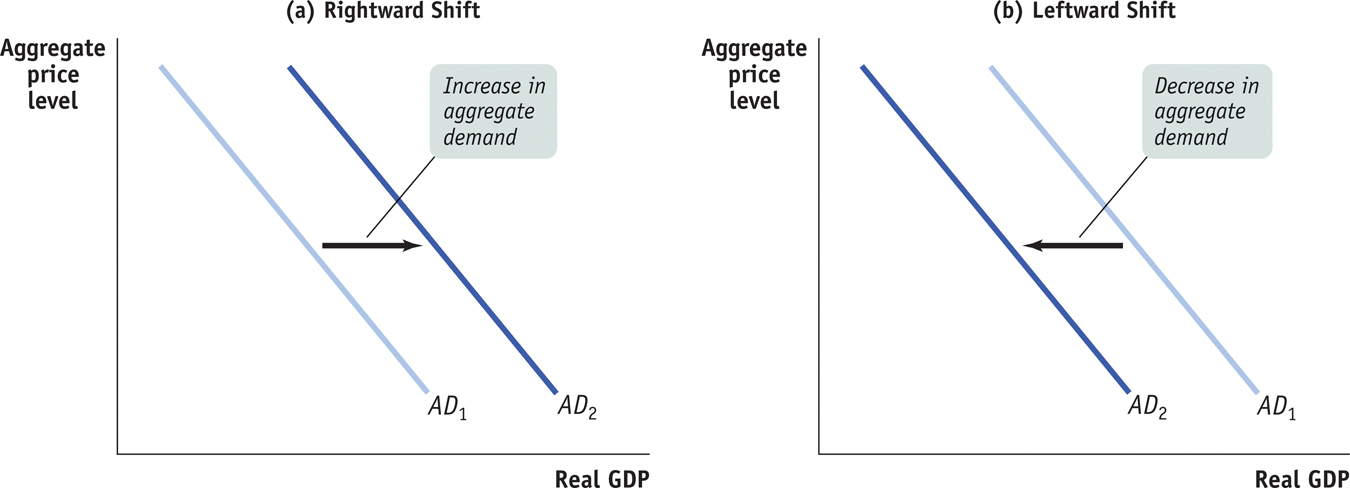
Shifts of the Aggregate Demand Curve Panel (a) shows the effect of events that increase the quantity of aggregate output demanded at any given aggregate price level, such as improvements in business and consumer expectations or increased government spending. Such changes shift the aggregate demand curve to the right, from AD1 to AD2. Panel (b) shows the effect of events that decrease the quantity of aggregate output demanded at any given aggregate price level, such as a fall in wealth caused by a stock market decline. This shifts the aggregate demand curve leftward from AD1 to AD2.