27-5
The Shor
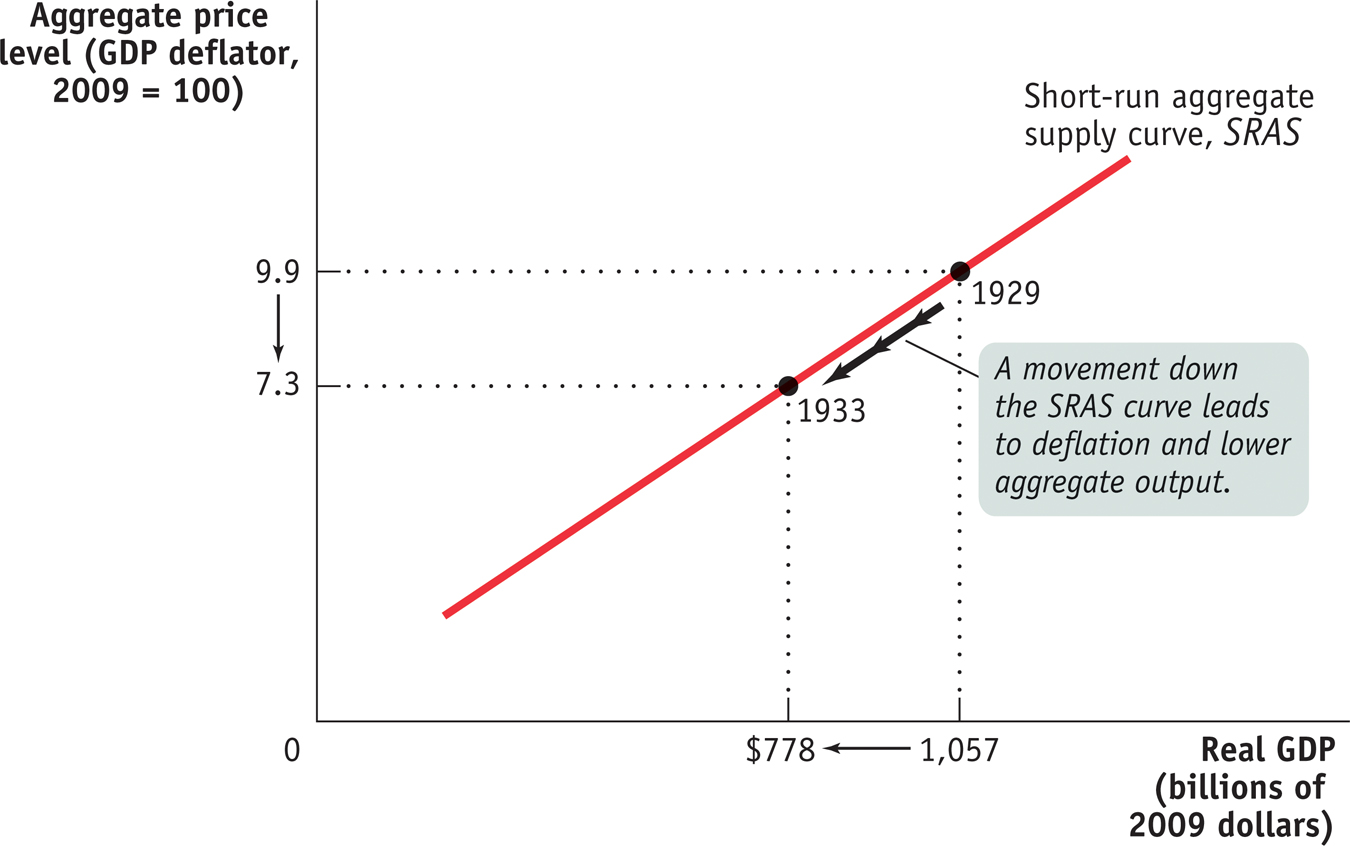
The Short- Run Aggregate Supply Curve The short- run aggregate supply curve shows the relationship between the aggregate price level and the quantity of aggregate output supplied in the short run, the period in which many production costs such as nominal wages are fixed. It is upward sloping because a higher aggregate price level leads to higher profit per unit of output and higher aggregate output given fixed nominal wages. Here we show numbers corresponding to the Great Depression, from 1929 to 1933: when deflation occurred and the aggregate price level fell from 9.9 (in 1929) to 7.3 (in 1933), firms responded by reducing the quantity of aggregate output supplied from $1,057 billion to $778 billion measured in 2009 dollars.