31-5
Unemployment and Inflation, 195
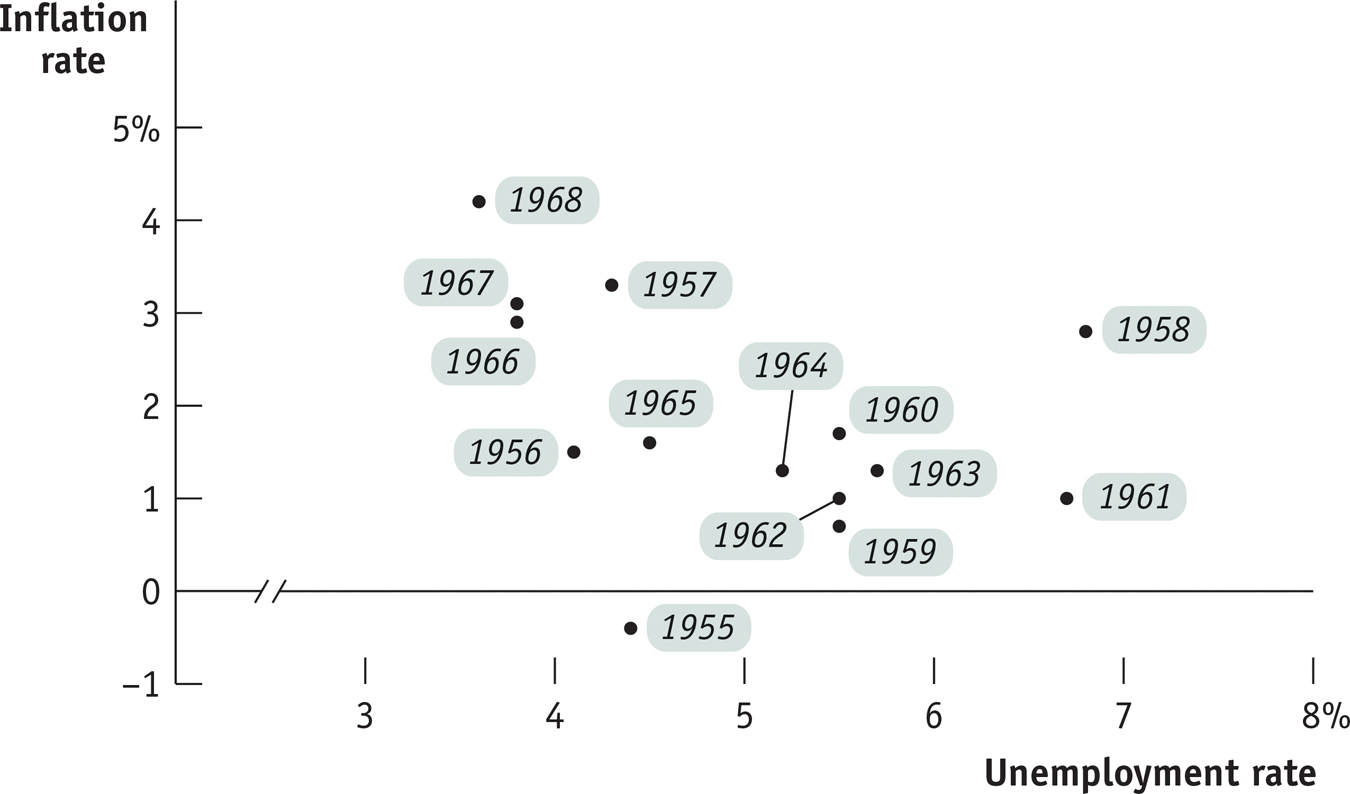
Unemployment and Inflation, 1955– 1968 Each dot shows the average U.S. unemployment rate for one year and the percentage increase in the consumer price index over the subsequent year. Data like this lay behind the initial concept of the Phillips curve.Source: Bureau of Labor Statistics.