Money and Inflation
As we’ll soon see, moderate levels of inflation such as those experienced in the United States—
To understand why, we need to revisit the effect of changes in the money supply on the overall price level. Then we’ll turn to the reasons governments sometimes increase the money supply very rapidly.
The Classical Model of Money and Prices
In Chapter 30 we learned that in the short run, an increase in the money supply increases real GDP by lowering the interest rate and stimulating investment spending and consumer spending. However, in the long run, as nominal wages and other sticky prices rise, real GDP falls back to its original level. So in the long run, an increase in the money supply does not change real GDP. Instead, other things equal, it leads to an equal percent rise in the overall price level; that is, the prices of all goods and services in the economy, including nominal wages and the prices of intermediate goods, rise by the same percentage as the money supply. And when the overall price level rises, the aggregate price level—
As a result, a change in the nominal money supply, M, leads in the long run to a change in the aggregate price level that leaves the real quantity of money, M/P, at its original level, with no long-
This is, to repeat, what happens in the long run. When analyzing large changes in the aggregate price level, however, macroeconomists often find it useful to ignore the distinction between the short run and the long run. Instead, they work with a simplified model in which the effect of a change in the money supply on the aggregate price level takes place instantaneously rather than over a long period of time. You might be concerned about this assumption, given that in previous chapters we’ve emphasized the difference between the short run and the long run. However, for reasons we’ll explain shortly, this is a reasonable assumption to make in the case of high inflation.
According to the classical model of the price level, the real quantity of money is always at its long-
A simplified model in which the real quantity of money, M/P, is always at its long-
Figure 31-1 reviews the effects of an increase in the money supply according to the AD–
31-1
The Classical Model of the Price Level
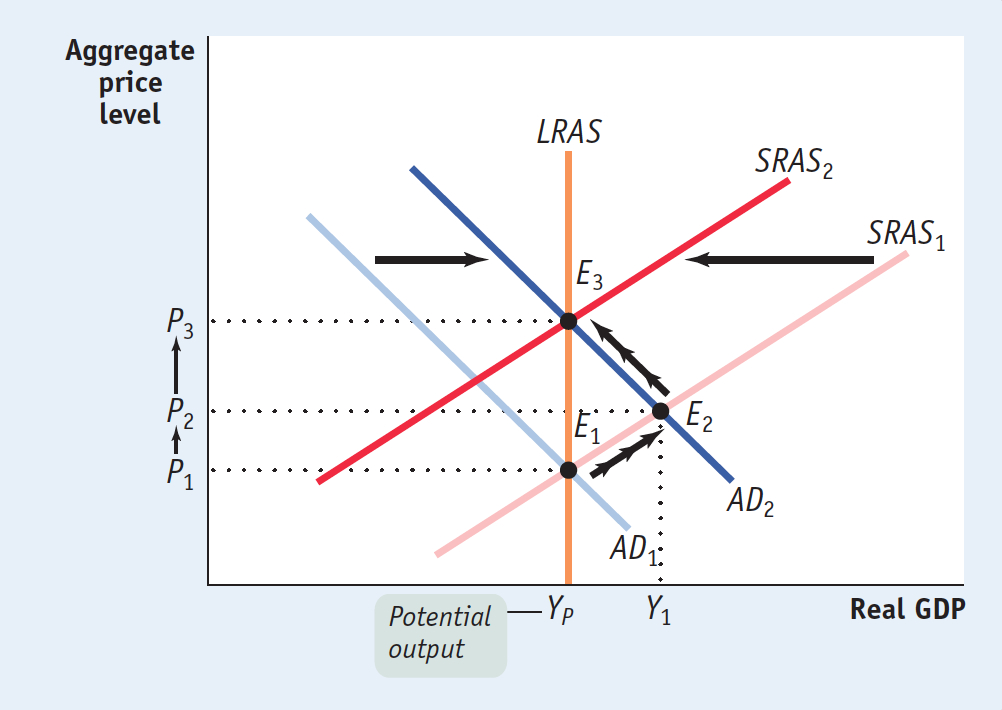
Now suppose there is an increase in the money supply. This is an expansionary monetary policy, which shifts the aggregate demand curve to the right, to AD2, and moves the economy to a new short-
The classical model of the price level ignores the short-
In reality, this is a poor assumption during periods of low inflation. With a low inflation rate, it may take a while for workers and firms to react to a monetary expansion by raising wages and prices. In this scenario, some nominal wages and the prices of some goods are sticky in the short run. As a result, under low inflation there is an upward-
But what about periods of high inflation? In the face of high inflation, economists have observed that the short-
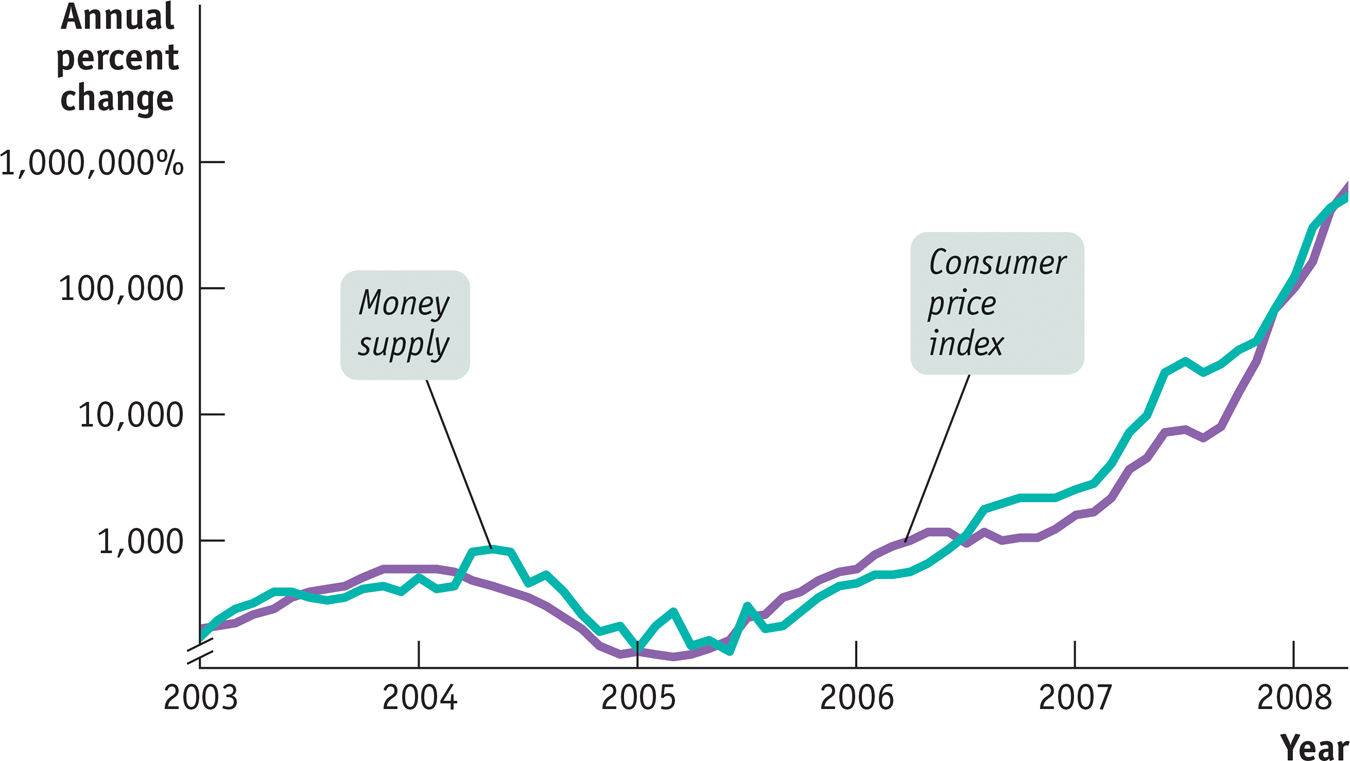
The consequence of this rapid adjustment of all prices in the economy is that in countries with persistently high inflation, changes in the money supply are quickly translated into changes in the inflation rate. Let’s look at Zimbabwe. Figure 31-2 shows the annual rate of growth in the money supply and the annual rate of change of consumer prices from 2003 through April 2008. As you can see, the surge in the growth rate of the money supply coincided closely with a roughly equal surge in the inflation rate. Note that to fit these very large percentage increases—
31-2
Money Supply Growth and Inflation in Zimbabwe
What leads a country to increase its money supply so much that the result is an inflation rate in the millions, or even billions, of percent?
The Inflation Tax
Modern economies use fiat money—
So what is to prevent a government from paying for some of its expenses not by raising taxes or borrowing but simply by printing money? Nothing. In fact, governments, including the U.S. government, do it all the time. How can the U.S. government do this, given that the Federal Reserve issues money, not the U.S. Treasury? The answer is that the Treasury and the Federal Reserve work in concert. The Treasury issues debt to finance the government’s purchases of goods and services, and the Fed monetizes the debt by creating money and buying the debt back from the public through open-
For example, in August 2007, the U.S. monetary base—
An alternative way to look at this is to say that the right to print money is itself a source of revenue. Economists refer to the revenue generated by the government’s right to print money as seignorage, an archaic term that goes back to the Middle Ages. It refers to the right to stamp gold and silver into coins, and charge a fee for doing so, that medieval lords—
Seignorage normally accounts for only a tiny fraction (less than 1%) of the U.S. government’s budget. Furthermore, concerns about seignorage don’t have any influence on the Federal Reserve’s decisions about how much money to print; the Fed is worried about inflation and unemployment, not revenue. But this hasn’t always been true, even in America: both sides relied on seignorage to help cover budget deficits during the Civil War. And there have been many occasions in history when governments turned to their printing presses as a crucial source of revenue.
According to the usual scenario, a government finds itself running a large budget deficit—
In such a situation, governments end up printing money to cover the budget deficit. But by printing money to pay its bills, a government increases the quantity of money in circulation. And as we’ve just seen, increases in the money supply sooner or later translate into equally large increases in the aggregate price level. So printing money to cover a budget deficit leads to inflation.
The inflation tax is the reduction in the value of money held by the public caused by inflation.
Who ends up paying for the goods and services the government purchases with newly printed money? The people who currently hold money pay. They pay because inflation erodes the purchasing power of their money holdings. In other words, a government imposes an inflation tax, the reduction in the value of the money held by the public, by printing money to cover its budget deficit and creating inflation.
It’s helpful to think about what this tax represents. If the inflation rate is 5%, then a year from now $1 will buy goods and services worth only $0.95 today. So a 5% inflation rate in effect imposes a tax rate of 5% on the value of all money held by the public.
But why would any government push the inflation tax to rates of hundreds or thousands of percent? We turn next to the logic of hyperinflation.
The Logic of Hyperinflation
Inflation imposes a tax on individuals who hold money. And, like most taxes, it will lead people to change their behavior. In particular, when inflation is high, people will try to avoid holding money and will instead substitute real goods as well as interest-

Moreover, people don’t just reduce their nominal money holdings—
We are now prepared to understand how countries can get themselves into situations of extreme inflation. High inflation arises when the government must print a large quantity of money, imposing a large inflation tax, to cover a large budget deficit.
Now, the seignorage collected by the government over a short period—

The money value of seignorage, however, isn’t very informative by itself. After all, the whole point of inflation is that a given amount of money buys less and less over time. So it’s more useful to look at real seignorage, the revenue created by printing money divided by the price level, P:

Equation 31-

or
Real seignorage = Rate of growth of the money supply × Real money supply
But as we’ve just explained, in the face of high inflation the public reduces the real amount of money it holds, so the far right-
As the process becomes self-
Here’s an analogy: imagine a city government that tries to raise a lot of money with a special fee on taxi rides. The fee will raise the cost of taxi rides, and this will cause people to turn to easily available substitutes, such as walking or taking the bus. As taxi use declines, the government finds that its tax revenue declines, and it must impose a higher fee to raise the same amount of revenue as before. You can imagine the ensuing vicious circle: the government imposes fees on taxi rides, which leads to less taxi use, which causes the government to raise the fee on taxi rides, which leads to even less taxi use, and so on.
Substitute the real money supply for taxi rides and the inflation rate for the increase in the fee on taxi rides, and you have the story of hyperinflation. A race develops between the government printing presses and the public: the presses churn out money at a faster and faster rate to try to compensate for the fact that the public is reducing its real money holdings. At some point the inflation rate explodes into hyperinflation, and people are unwilling to hold any money at all (and resort to trading in eggs and lumps of coal). The government is then forced to abandon its use of the inflation tax and shut down the printing presses.
!worldview! ECONOMICS in Action: Zimbabwe’s Inflation
Zimbabwe’s Inflation
As we noted in this chapter’s opening story, Zimbabwe offers a recent example of a country experiencing very high inflation. Figure 31-2 showed that surges in Zimbabwe’s money supply growth were matched by almost simultaneous surges in its inflation rate. But looking at rates of change doesn’t give a true feel for just how much prices went up.
31-3
Consumer Prices in Zimbabwe, 2000–
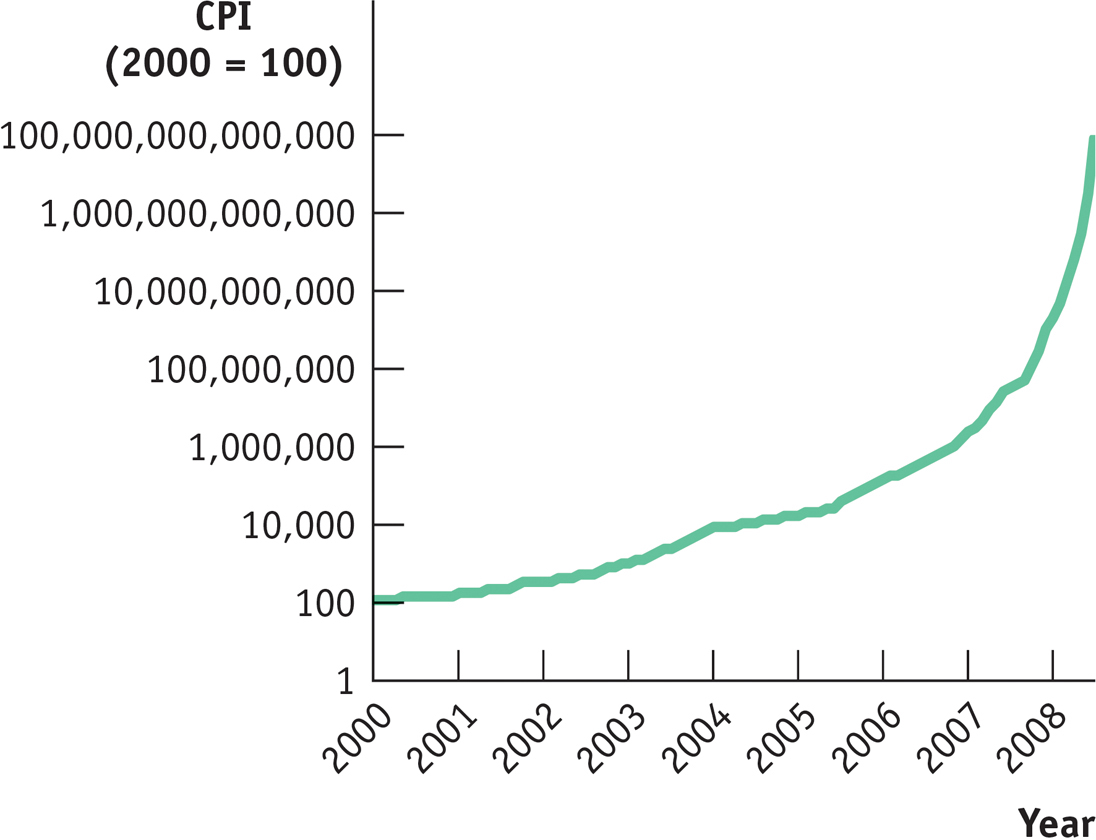
Figure 31-3 shows Zimbabwe’s consumer price index from January 2000 to July 2008, with the January 2000 level set equal to 100. As in Figure 31-2, we also use a logarithmic scale. Over the course of just over eight years, consumer prices rose by approximately 80 trillion percent.
Why did Zimbabwe’s government pursue policies that led to runaway inflation? The reason boils down to political instability, which in turn had its roots in Zimbabwe’s history. Until the 1970s, Zimbabwe had been ruled by its small white minority; even after the shift to majority rule, many of the country’s farms remained in the hands of whites. Eventually Robert Mugabe, Zimbabwe’s president, tried to solidify his position by seizing these farms and turning them over to his political supporters.
But because this seizure disrupted production, the result was to undermine the country’s economy and its tax base. It became impossible for the country’s government to balance its budget either by raising taxes or by cutting spending. At the same time, the regime’s instability left Zimbabwe unable to borrow money in world markets. Like many others before it, Zimbabwe’s government turned to the printing press to cover the gap—
Quick Review
The classical model of the price level does not distinguish between the short and the long run. It explains how increases in the money supply feed directly into inflation. It is a good description of reality only for countries with persistently high inflation or hyperinflation.
Governments sometimes print money to cover a budget deficit. The resulting loss in the value of money is called the inflation tax.
A high inflation rate causes people to reduce their real money holdings, leading to the printing of more money and higher inflation in order to collect the inflation tax. This can cause a self-
reinforcing spiral into hyperinflation.
31-1
Question 16.1
Suppose there is a large increase in the money supply in an economy that previously had low inflation. As a consequence, aggregate output expands in the short run. What does this say about situations in which the classical model of the price level applies?
The inflation rate is more likely to quickly reflect changes in the money supply when the economy has had an extended period of high inflation. That’s because an extended period of high inflation sensitizes workers and firms to raise nominal wages and prices of intermediate goods when the aggregate price level rises. As a result, there will be little or no increase in real output in the short run after an increase in the money supply, and the increase in the money supply will simply be reflected in an equal-sized percent increase in prices. In an economy where people are not sensitized to high inflation because of low inflation in the past, an increase in the money supply will lead to an increase in real output in the short run. This illustrates the fact that the classical model of the price level best applies to economies with persistently high inflation, not those with little or no history of high inflation even though they may currently have high inflation.
Question 16.2
Suppose that all wages and prices in an economy are indexed to inflation—
that is, wages and prices are automatically adjusted to incorporate the latest inflation figures. Can there still be an inflation tax? Yes, there can still be an inflation tax because the tax is levied on people who hold money. As long as people hold money, regardless of whether prices are indexed or not, the government is able to use seignorage to capture real resources from the public.
Solutions appear at back of book.