FIGURE 2A- 1 Plotting Points on a Two- Variable Graph
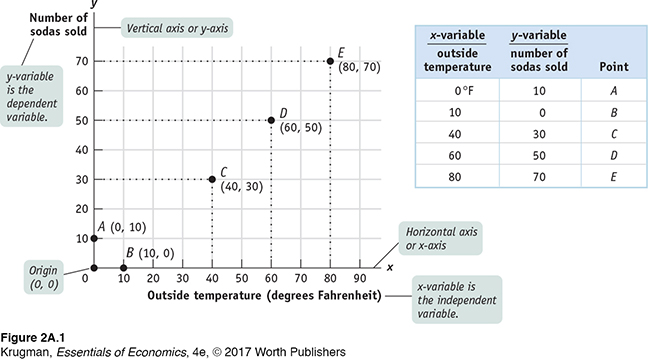
The data from the table are plotted where outside temperature (the independent variable) is measured along the horizontal axis and number of sodas sold (the dependent variable) is measured along the vertical axis. Each of the five combinations of temperature and sodas sold is represented by a point: A, B, C, D, and E. Each point in the graph is identified by a pair of values. For example, point C corresponds to the pair (40, 30)—an outside temperature of 40°F (the value of the x-variable) and 30 sodas sold (the value of the y-variable).