FIGURE 2A-2 Drawing Curves
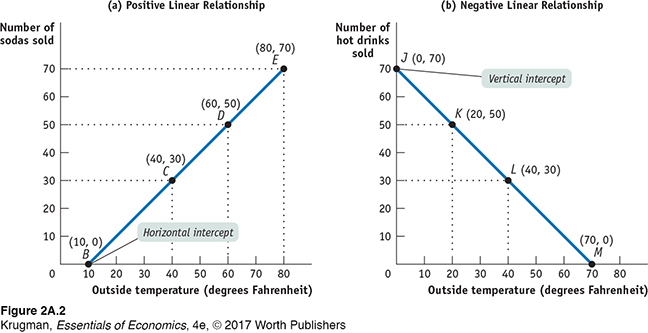
The curve in panel (a) illustrates the relationship between the two variables, outside temperature and number of sodas sold. The two variables have a positive linear relationship: positive because the curve has an upward tilt, and linear because it is a straight line. It implies that an increase in the x-variable (outside temperature) leads to an increase in the y-variable (number of sodas sold). The curve in panel (b) is also a straight line, but it tilts downward. The two variables here, outside temperature and number of hot drinks sold, have a negative linear relationship: an increase in the x-variable (outside temperature) leads to a decrease in the y-variable (number of hot drinks sold). The curve in panel (a) has a horizontal intercept at point B, where it hits the horizontal axis. The curve in panel (b) has a vertical intercept at point J, where it hits the vertical axis, and a horizontal intercept at point M, where it hits the horizontal axis.