FIGURE 2A-3 Calculating the Scope
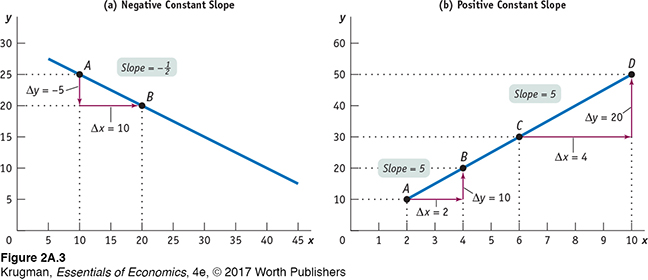
Panels (a) and (b) show two linear curves. Between points A and B on the curve in panel (a), the change in y (the rise) is −5 and the change in x (the run) is 10. So the slope from A to B is , where the negative sign indicates that the curve is downward sloping. In panel (b), the curve has a slope from A to B of . The slope from C to D is . The slope is positive, indicating that the curve is upward sloping. Furthermore, the slope between A and B is the same as the slope between C and D, making this a linear curve. The slope of a linear curve is constant: it is the same regardless of where it is measured along the curve.