FIGURE 2A-4 Nonlinear Curves
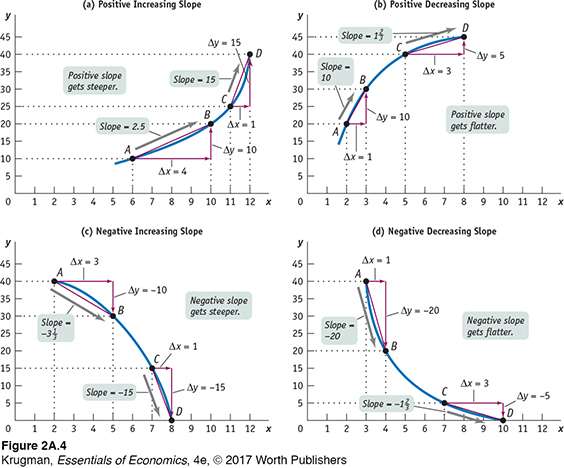
In panel (a) the slope of the curve from A to B is , and from C to D it is . The slope is positive and increasing; the curve gets steeper as you move to the right. In panel (b) the slope of the curve from A to B is , and from C to D it is . The slope is positive and decreasing; the curve gets flatter as you move to the right. In panel (c) the slope from A to B is , and from C to D it is = . The slope is negative and increasing; the curve gets steeper as you move to the right. And in panel (d) the slope from A to B is , and from C to D it is . The slope is negative and decreasing; the curve gets flatter as you move to the right. The slope in each case has been calculated by using the arc method—that is, by drawing a straight line connecting two points along a curve. The average slope between those two points is equal to the slope of the straight line between those two points.