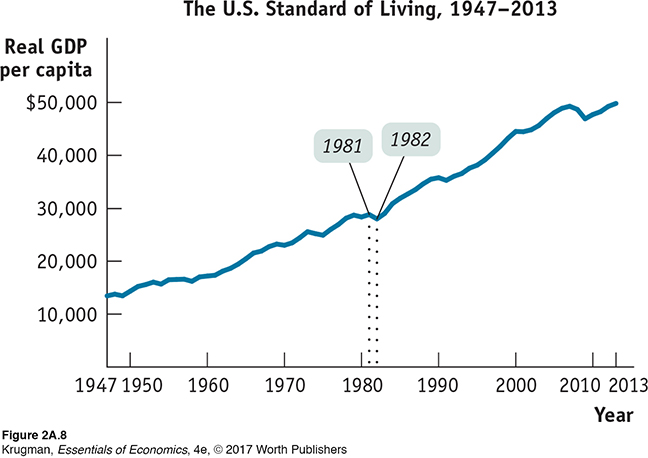
Time-series graphs show successive dates on the x-axis and values for a variable on the y-axis. This time-series graph shows real gross domestic product per capita, a measure of a country’s standard of living, in the United States from 1947 to late 2013.Data from: Bureau of Economic Analysis.