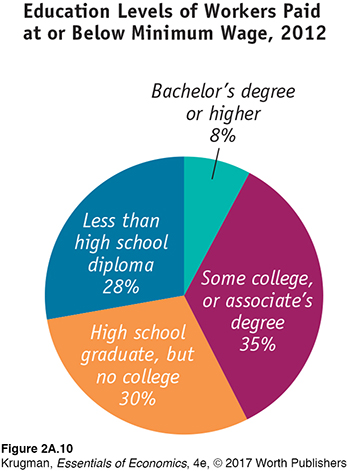
A pie chart shows the percentages of a total amount that can be attributed to various components. This pie chart shows the percentages of workers with given education levels who were paid at or below the federal minimum wage in 2012.Data from: Bureau of Labor Statistics.