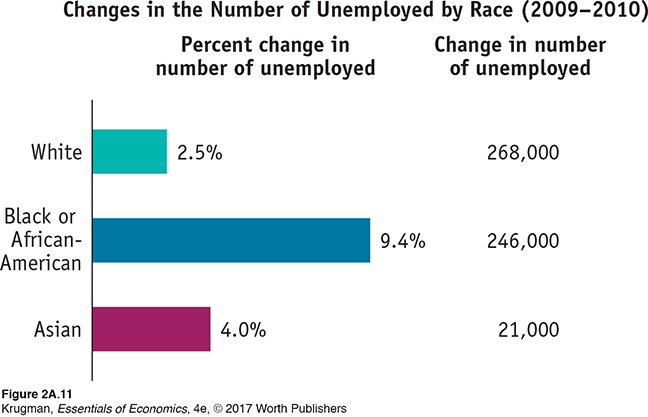
A bar graph measures a variable by using bars of various heights or lengths. This bar graph shows the percent change in the number of unemployed workers between 2009 and 2010, separately for White, Black or African-American, and Asian workers.Data from: Bureau of Labor Statistics.